Figure 2.

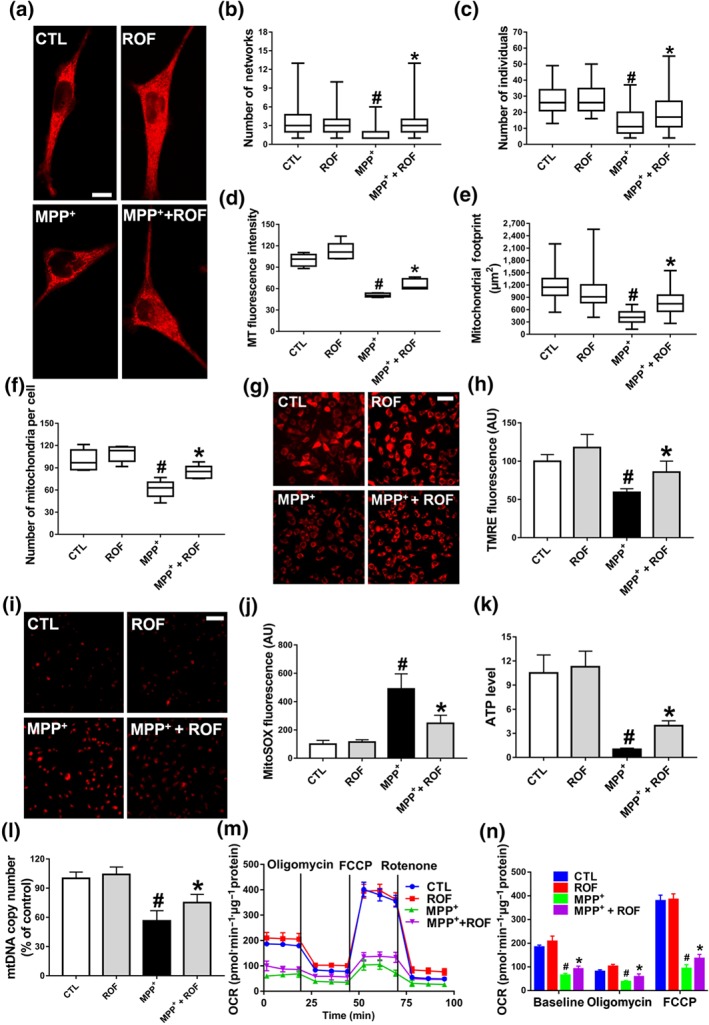
Effect of roflupram on mitochondrial morphology and function of MPP+‐treated cells. (a) SH‐SY5Y cells were pretreated with roflupram (ROF; 20 μM) for 1 hr and were then treated with 500 μM of MPP+ for 24 hr. Mitotracker Red was added to mark mitochondria. Scale bar = 10 μm. Statistical analysis was performed on 100 cells in each group to obtain five data sets; the number of networks (b), number of individuals (c), MT fluorescence intensity (d), mitochondrial footprint (e), and the number of mitochondria per cell (f). After treating the cells with roflupram for 1 hr, 500 μM of MPP+ was added for 24 hr to measure mitochondrial membrane potential (MMP) (g) and oxidative stress (i), and statistical analyses were determined via TMRE fluorescence (h) and MitoSOX fluorescence (j). (k) The cells were pretreated with roflupram (20 μM) for 1 hr and then treated with 500 μM of MPP+ for 24 hr. ATP levels were detected with an ATP Assay Kit. (l) mtDNA copy number was measured in SH‐SY5Y cells by real‐time PCR. (m) Oxygen consumption rate (OCR) was measured in SH‐SY5Y cells using the Seahorse XF‐24 Analyzer in response to the sequential administration of oligomycin (1 μM), FCCP (0.5 μM) and rotenone (2 μM). (n) Quantification of OCR in panel (M). In (a, g, i) the scale bar = 500 μm. Data are from five independent experiments and are presented as box and whisker plots in (b, c, d, e, f), with medians, quartiles and ranges shown. In (h, j, k, l, m, n), data are shown as means ± SD. # P < .05, significantly different from control group. *P < .05, significantly different from MPP+‐treated group
