
Figure 3.
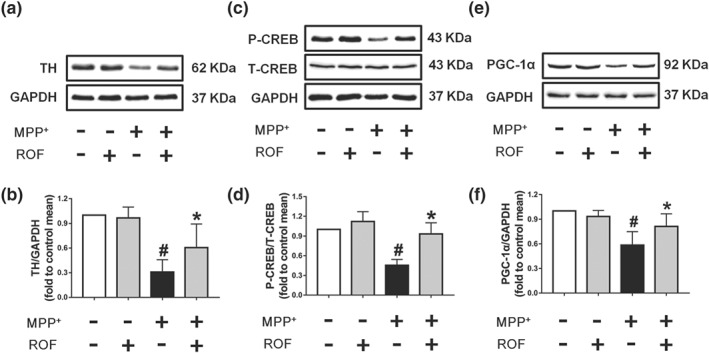
Effect of roflupram on the expression of related proteins of MPP+‐treated cells. SH‐SY5Y cells were pretreated with roflupram (ROF; 20 μM) for 1 hr and then treated with 500 μM of MPP+ for 24 hr. After the cells were processed, the expression of TH (a), p‐CREB (c), and PGC‐1α (e) were measured by western blotting. (b) Densitometric quantification of TH/GAPDH in (a). (d) Densitometric quantification of p‐CREB/T‐CREB in (c). (f) Densitometric quantification PGC‐1α/GAPDH in (e). Data are presented as mean ± SD (n = 5) and represent five independent experiments. # P < .05, significantly different from control group. *P < .05, significantly different from MPP+‐treated group