
Figure 4.
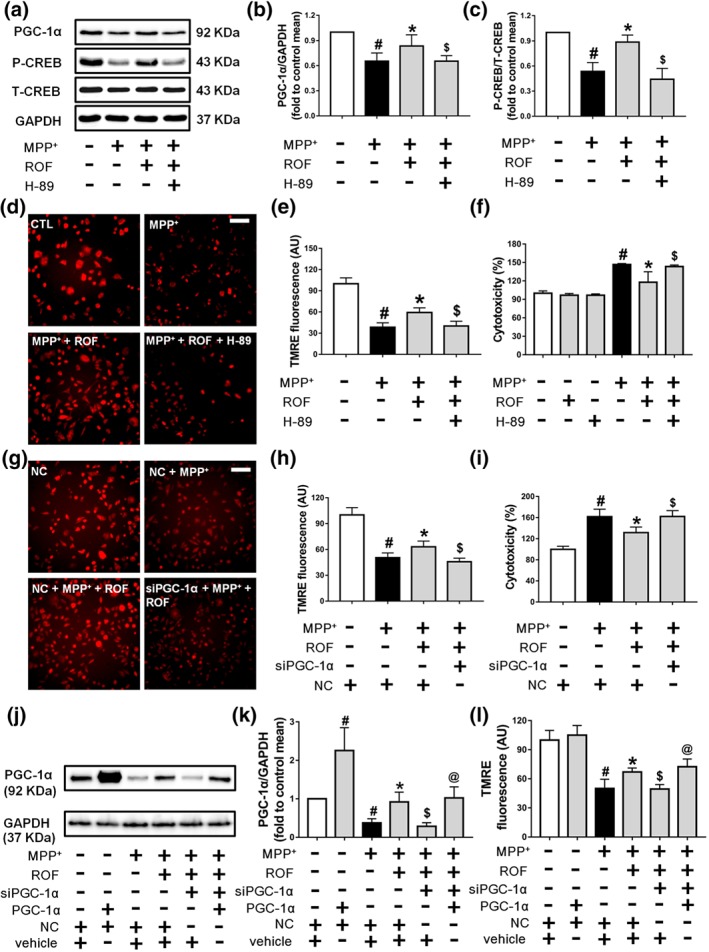
The CREB/PGC‐1α pathway is involved in the protective effects of roflupram in MPP+‐treated cells. (a) SH‐SY5Y cells were pretreated with H‐89 (10 μM) for 1 hr and then treated with roflupram (ROF; 20 μM) for 1 hr; after that, 500 μM of MPP+ was added for 24 hr. After the cells were processed, the expression levels of PGC‐1α, p‐CREB, and total CREB were measured by western blotting. (b and c) Densitometric quantification of PGC‐1α/GAPDH (b) in (a) and p‐CREB/T‐CREB (c) in (a). (d) The cells were pretreated with H‐89 (10 μM) for 1 hr and then treated with roflupram (20 μM) for 1 hr. Subsequently, 500 μM of MPP+ was added to stimulate with cells for 24 hr. After treatment, the cells were washed with PBS and dyed with TMRE (50 nM) for 20 min. Finally, the cells were viewed under a fluorescence microscope. Scale bar = 500 μm. (e) Statistical analysis of fluorescent photographs in (d). (f) The cells were pretreated with H‐89 (10 μM) for 1 hr and then treated with roflupram (20 μM) for 1 hr; after that, 500 μM of MPP+ was added for 48 hr. After treatment, LDH activity in the medium was measured. (g) Transfected cells were pretreated with ROF (20 μM) for 1 hr, and then, 500 μM of MPP+ was added for 24 hr. After the cells were processed, the cells were dyed with TMRE (50 nM) for 20 min. Finally, the cells were placed under a fluorescent microscope for imaging. Scale bar = 500 μm. (h) Statistical analysis of fluorescent pictures in (g). (i) Transfected cells were pretreated with ROF (20 μM) for 1 hr, and 500 μM of MPP+ was added for 48 hr. After treatment, LDH activity in the medium was detected. (j) SH‐SY5Y cells were transfected for 24 hr with PGC‐1α plasmid and with PGC‐1α siRNA or random siRNA. Transfected cells were then treated with MPP+ for an additional 24 hr. The expression of PGC‐1α was measured by western blotting. (k) Densitometric quantification of PGC‐1α/GAPDH in (j). (l) After transfection and treatment with MPP+, the cells were dyed with TMRE (50 nM) for 20 min before imaging under a fluorescent microscope. Fluorescent pictures were analysed statistically. Data are presented as mean ± SD (n = 5) and represent five independent experiments. # P < .05, significantly different from control group or negative control group. *P < .05, significantly different from MPP+‐treated group. $ P < .05, significantly different from versus MPP+ + ROF‐treated group. @ P < .05, significantly different from siPGC‐1α + MPP+ + ROF‐treated group