
Figure 9.
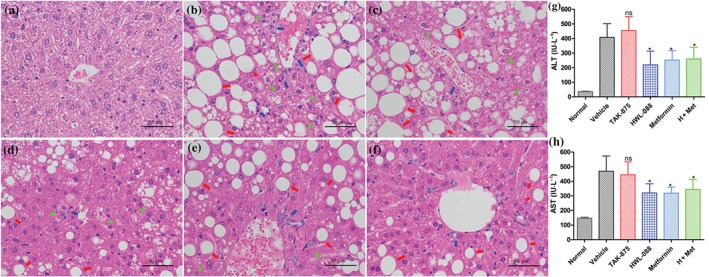
Effect of HWL‐088 on the histological alterations and fat accumulation in liver of ob/ob mice after 30 days of treatment. Representative photomicrographs of histological alterations in liver stained with haematoxylin–eosin at 400× magnification (a: normal control; b: vehicle group; c: TAK‐875 treated group; d: HWL‐088 treated group; e: metformin treated group; f: HWL‐088 and metformin treated group). Empty/hollow spaces show fat globules or accumulation (macro‐vesicular steatosis). Steatosis: red arrow, inflammation: blue arrow, ballooning: luminous yellow arrow. Histograms show the plasma levels of Alanine transaminase (ALT, g) and aspartate transaminase (AST, h). All the values are expressed as mean ± SD (n = 6). *P ≤ .05 versus vehicle were analysed using a one‐way ANOVA with Tukey's multiple‐comparison post hoc test