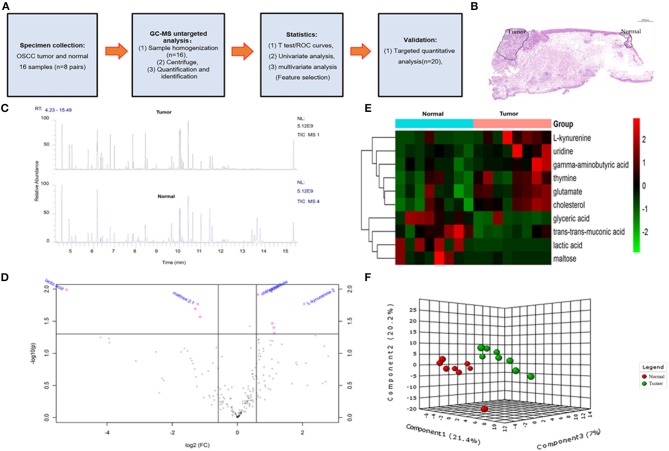
Figure 1.
The overall design idea of this experiment and preliminary screening of differential metabolite in untargeted group. (A) Research flowchart: including specimen collection, GC-MS analysis untargeted analysis, data analysis, and UHPLC-MS targeted validation. (B) Schematic diagram of sample collection site, tumor, and normal tissue. (C) Mass spectrometry of the tumor and normal tissue. (D) Volcano plot analysis between tumor and normal by t-test. (E) Comparison of tumor and normal using normalized intensities of 10 significance metabolites. The mean value of 10 metabolites in each group was obtained, and then Z-score transformation generates heat map. (F) Scores plot segregated tumor and normal by PLS-DA analysis in untargeted group.

