Figure 4.
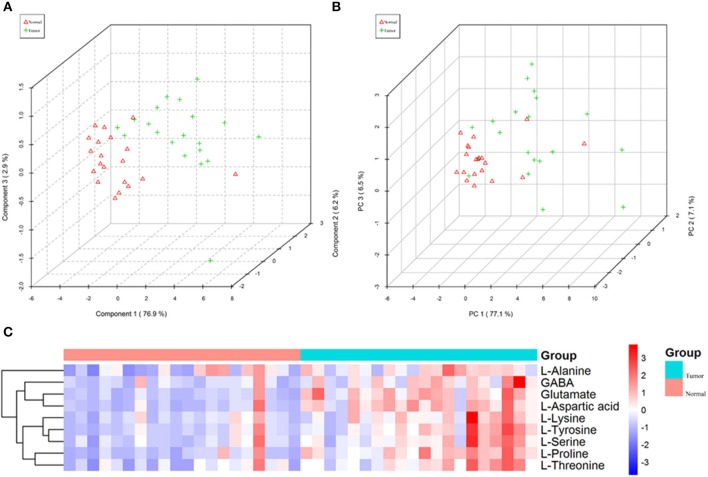
The nine amino acids identified by quantitative analysis can significantly distinguish tumors from normal tissues in the targeted group. (A) Scores plot accurately distinguishes tumor and normal by PLS-DA analysis in the targeted group. (B) Scores plot distinguishes tumor and normal by PCA analysis in the targeted group. (C) Comparison of tumor and normal using normalized intensities of nine significance metabolites in the targeted group. The mean value of nine metabolites in each group was obtained, and then Z-score transformation generates heat map.

