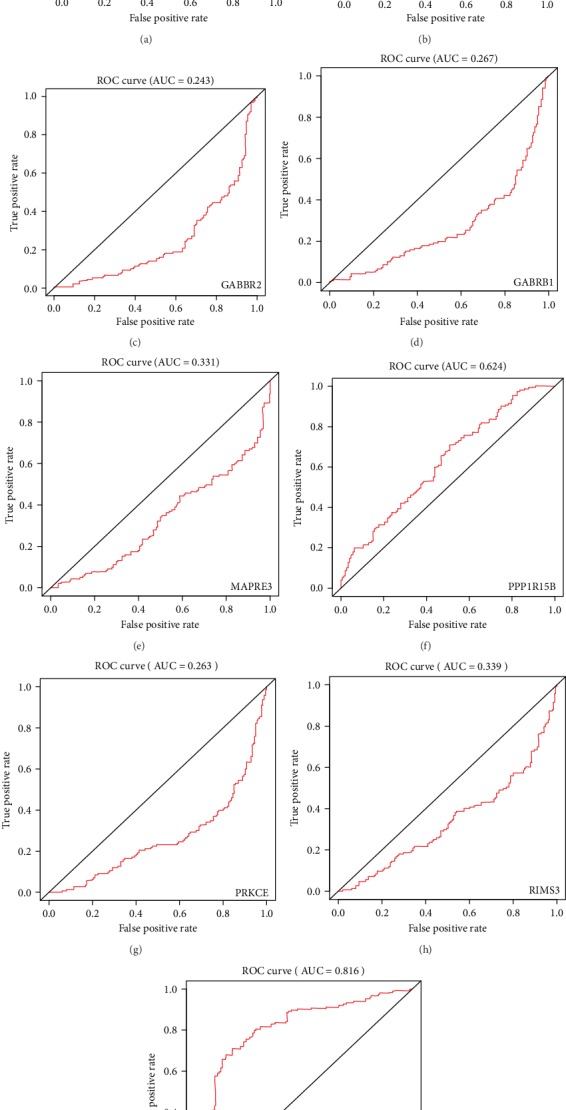
Figure 3.

Receiver operating characteristic (ROC) curve analysis of overlapping mRNAs. To investigate the accuracy of overlapping mRNAs as a predictor of patient outcomes, we performed ROC curve analysis of CEP55 (a), CSRP2 (b), GABBR2 (c), GABRB1 (d), MAPRE3 (e), PPP1R15B (f), PRKCE (g), RIMS3 (h), and SHCBP1 (i). AUC values represent the area under the curve.
