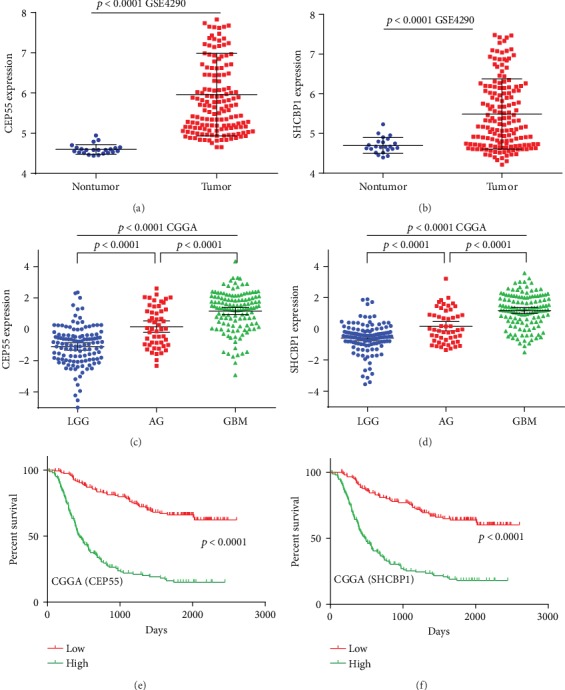
Figure 4.

CEP55 and SHCBP1 expression levels in gliomas and their relationship to prognosis. (a, b) Expression of CEP55 (a) and SHCBP1 (b) in nontumor brain tissue and glioma tissues. (c, d) Expression of CEP55 (c) and SHCBP1 (d) in glioma tissues of different levels. (e, f) Kaplan–Meier survival curve analysis of the prognostic significance of CEP55 and SHCBP1 expression in glioma patients.
