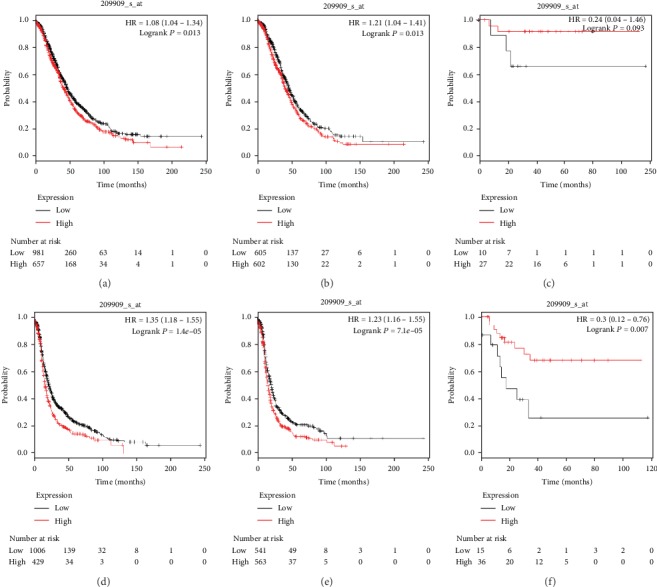
Figure 3.

The prognostic value of TGF-β2 for predicting OS and PFS in ovarian cancer patients. OS curves were plotted for all ovarian cancer patients (N = 1,656, a), serous ovarian cancer patients (N = 1,207, b), and endometrioid ovarian cancer patients (N = 37, c); PFS curves were plotted for all ovarian cancer patients (N = 1,435, d), serous ovarian cancer patients (N = 1,104, e), and endometrioid ovarian cancer patients (N = 51, f).
