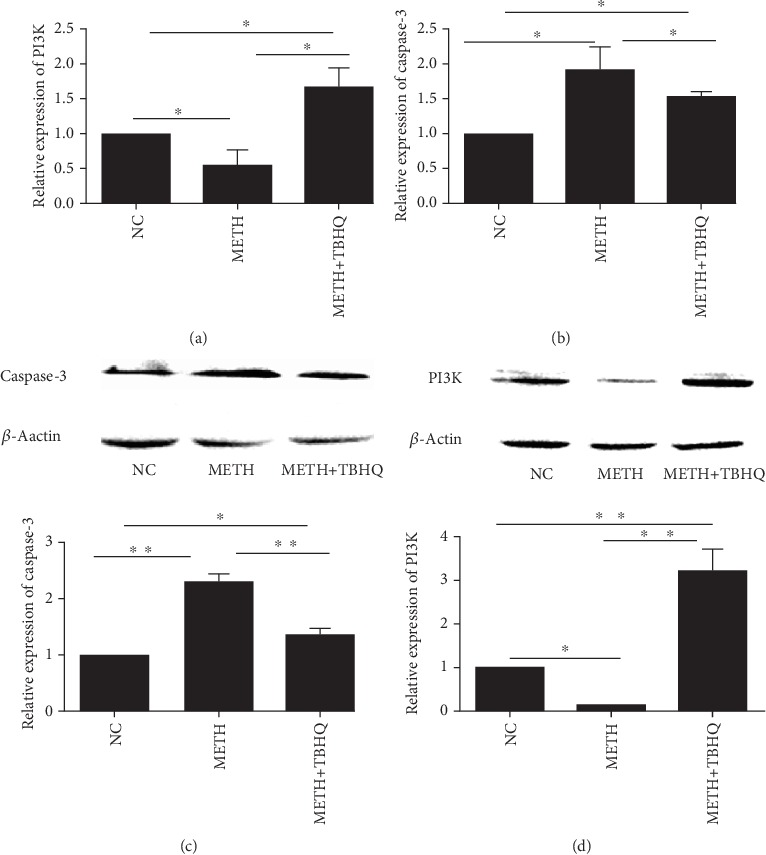
Figure 7.

Effects of METH and TBHQ on the gene and protein immunocontent of PI3K and caspase-3. (a) Quantitative PCR analysis of VTA PI3K mRNA levels. (b) Quantitative PCR analysis of VTA caspase-3 mRNA levels. (c, d) Representative Western blot images and analysis of PI3K and caspase-3. The data are expressed as the means ± SEMs of three independent experiments. n = 5. ∗p < 0.05, ∗∗p < 0.01.
