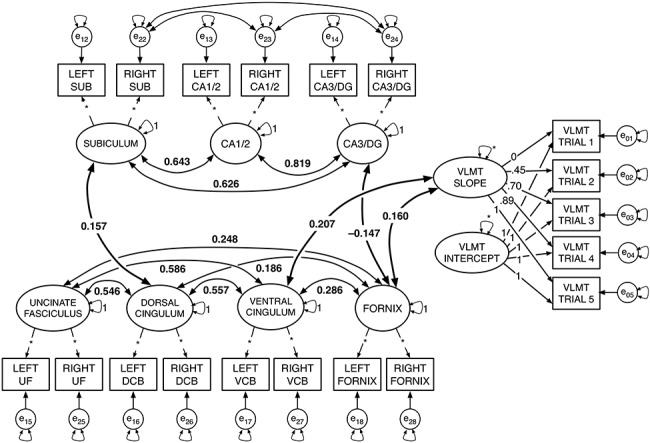
Figure 1.

Diagram of the “combined model,” with only significant correlations (i.e., P < 0.05) shown. The estimated model included the fully saturated latent correlation matrix. Larger ellipses with small double-headed arrows represent latent factors with variance either fixed at 1 or freely estimated (*). Small single-headed arrows between factors and their respective observed indicators reflect factor loadings, with the value of the factor loading prespecified (i.e., based on estimated loadings from earlier modeling steps) or freely estimated (*). The rectangles reflect the observed indicators for each measurement, and the small circles with double-headed arrows reflect their residuals and residual variance; all residual error variance parameters were freely estimated. In the LGM portion on the right side of the figure, factor loadings for the LGM slope factor were originally estimated using a latent basis free model. The intercept (i.e., all factor loadings fixed to 1), and slope with factor loadings represent individual differences in growth across the verbal learning trials. (See Supplementary Table SM3 for a comparison for factor loadings and fit to a model with linear slope). Larger curved bidirectional arrows represent significant covariances between factors (P < 0.05), and covariance path values reflect standardized parameters. The figure shows only the significant associations within each brain domain (i.e., among HC subfield factors, and among factors for WM tract FA), and between WM and HC factors. In addition, the bold covariance double-headed arrows show significant associations between brain factors and the slope factor for the LGM on learning trials.
