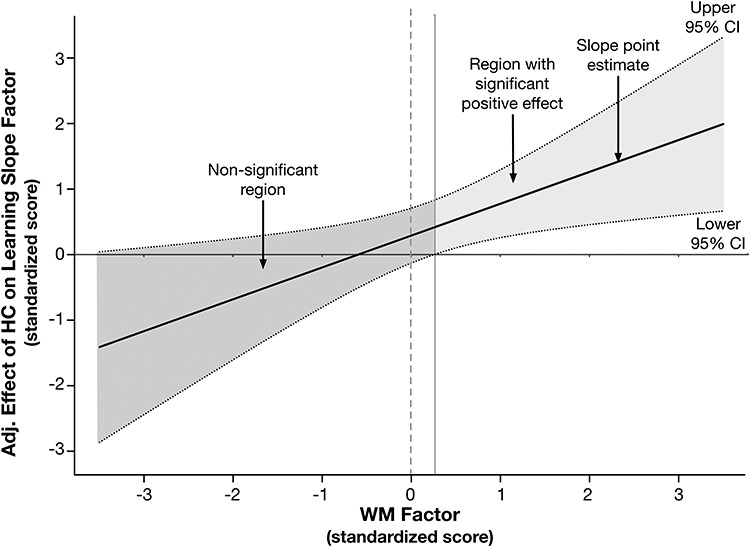
Figure 3.

Johnson-Neyman plot illustrating the decomposed interaction to test the moderating effect of limbic WM FA on the effect of HC volume on the verbal learning slope factor. The x-axis represents the continuous moderator—here, the standardized WM factor score, and the y-axis represents the effect of the hippocampus (HC) latent factor in the latent interaction on the verbal learning slope parameter, adjusted for other model parameters. The solid regression line reflects the association between the adjusted effect of the HC factor on the learning slope factor, as a function of level in the WM factor. The dotted lines represent the upper and lower 95% confidence band around the regression slope. The solid horizontal line at y = 0, and the dotted vertical line at x = 0 are superimposed to assist with interpretation. Regions where the confidence bands overlap with y = 0 indicates the levels of the x-variable in which the effect represented by the regression slope are not significant; this is denoted by dark gray shading. The confidence bands overlap with zero until the WM factor score is slightly greater than 0.15, demonstrating that the adjusted effect of HC volume on learning is only apparent at nonnegative values of the WM factor (i.e., area with lighter gray shading).
