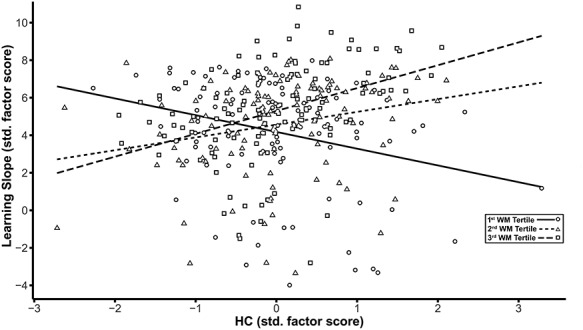
Figure 4.

Decomposition of the effects of the latent interaction between hippocampus (HC) and WM on the latent factor representing the slope across learning trials based on WM tertiles. The scatter plot shows the HC factor score on the x-axis plotted against the learning slope factor on the y-axis, with linear smoothers fitted separately for each of the three tertiles of the WM distribution. Scales for both axes are depicted using standardized scores. Separate symbols and fitted regression lines represent each of the three tertiles of the WM distribution representing low, middle, and high FA values. Greater HC volume is associated with higher learning slope only in the middle (short-dashed regression line and triangle symbols) and highest tertiles (long-dashed regression line and square symbols) of the WM factor. For the lowest tertile of WM (solid regression line and circle symbols), higher HC volume is associated with lower learning rate.
