
Figure 4.
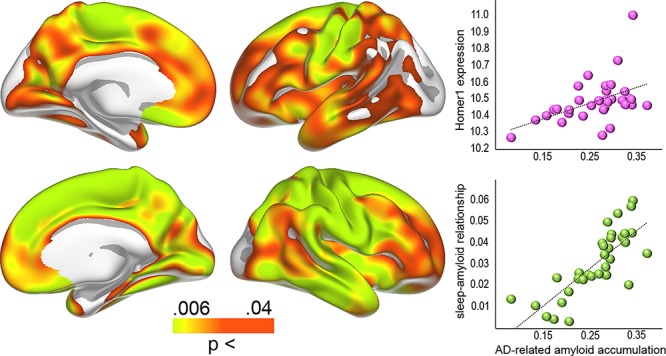
Aβ levels in AD and gene expression. Left: Regions with significantly higher levels of Aβ in MCI/AD patients compared with cognitively normal controls. Right: Bubble plot of the relationship between the patients versus controls differences in Aβ accumulation across 34 cortical regions (gamma values) and regional HOMER1 expression levels (top) and the strength of the sleep-Aβ relationship in the youngest group (gamma values) versus the patients-controls differences (bottom).