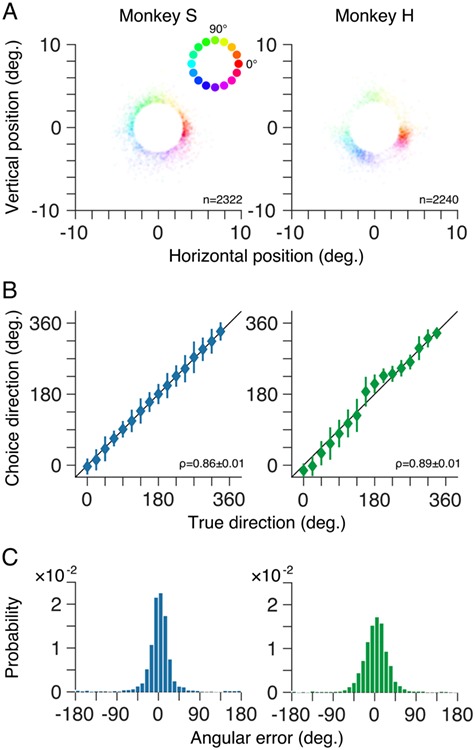
Figure 3.

Choices reflect stimulus motion direction after training. (A) Distributions of saccade end-points for noncued trials for both marmosets as kernel density plots. At each spatial location, target motion direction is represented by the hue (see inset) while the density of saccade end-points (i.e., trials) is represented by the saturation. For the trials shown, random dot patterns moved coherently in one of 50 possible directions between 0 and 360°. (B) Mean choice direction (symbols) for noncued trials plotted against target motion direction. Behavioral choices of both marmosets were highly correlated with the target motion direction. Error bars show ±1 standard deviation. (C) Distributions of angular error, the difference between the marmoset’s choice and the true motion direction on each trial, for both marmosets.
