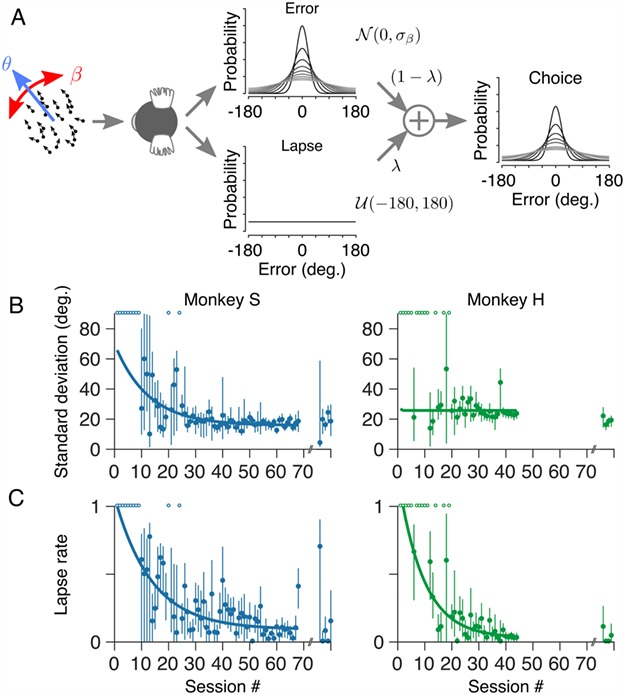
Figure 4.

Motion estimation performance improved with training. (A) To quantify behavioral performance, both during training and subsequently on the main task, we modeled the distributions of angular errors as a mixture of two probability distributions: a uniform distribution (reflecting nonperceptual errors or “lapses”) and a wrapped normal distribution (reflecting errors in perceptual processing of the motion stimulus). The relative contribution of these two distributions is determined by the lapse rate, λ. Task performance is quantified by the standard deviation, σ, of the wrapped normal distribution. (B) Standard deviation of both marmosets’ errors plotted as a function of training session number. (C) Lapse rate plotted as a function of training session number for both marmosets. The lapse rate of both marmosets decreased with training. Note that we were unable to fit the mixture model in some sessions, particularly early in training when the marmosets performed relatively few noncued trials in each session. Sessions containing too few (<30) noncued trials are indicated by open symbols at the top of the axes in B and C. Symbols on the far right of each panel in B and C show standard deviation and lapse rate, respectively, after more than 1 year of training (see Fig. 2). Solid curves show least-squares fits of a single exponential function.
