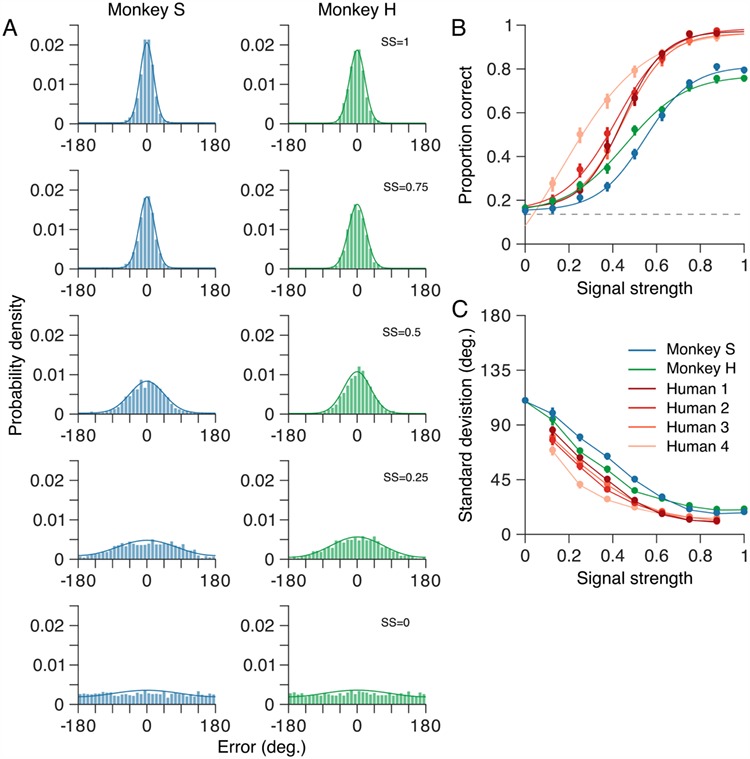
Figure 5.

Perceptual errors vary systematically with motion SS. (A) Distributions of angular errors—the difference between the marmoset’s choice and the true motion direction on each trial—for a range of motion SSs (see Material and Methods). Signal strength, SS = 1, corresponds to coherent motion while SS = 0 corresponds to random, incoherent motion. Error distributions (bars) of both monkeys became broader as SS was reduced. The data include 17 021 trials, across all conditions, from 85 sessions for monkey S and 17 937 trials from 77 sessions for monkey H. Solid curves show the probability density defined by the mixture model (see Materials and Methods) fitted to the error distributions. (B) Proportion of correct (i.e., rewarded) trials as a function of SS. Proportion correct for both marmosets decreased as SS was reduced. In the absence of any coherent motion signal (SS = 0), both marmosets performed at the chance level (dashed line). (C) Standard deviation of the mixture model, fitted to each marmoset’s errors, as a function of stimulus strength. The standard deviation of both marmosets’ errors increased as SS was reduced. For comparison, B and C show comparable metrics for four human observers performing the same motion estimation task (see Material and methods). The human observers performed better than the marmosets over all SSs. In B and C, error bars show bootstrap estimates of the 95% CI for the corresponding metric. Solid curves in B show maximum likelihood fits of a logistic function.
