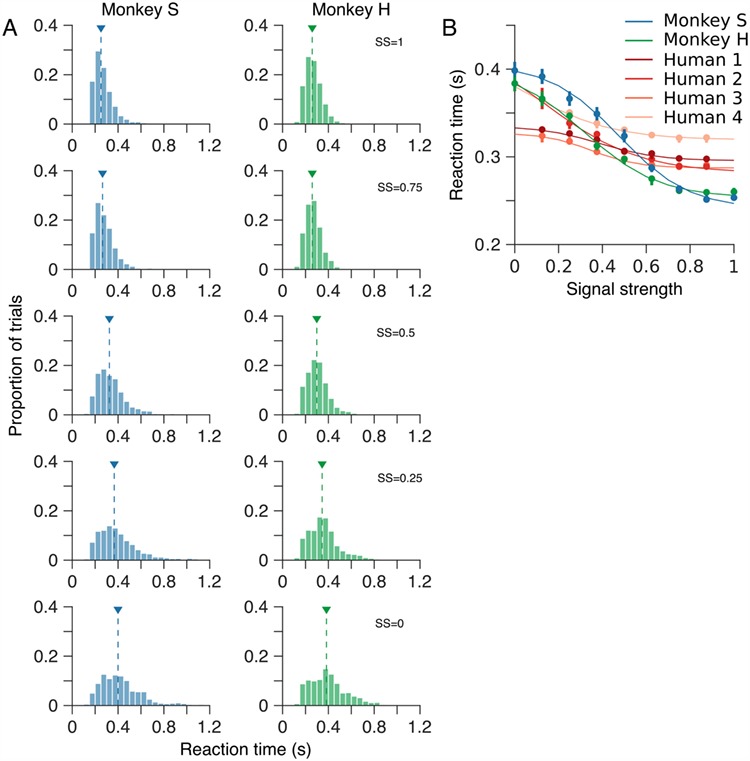
Figure 6.

Reaction time varies systematically with motion SS. (A) Distributions of reaction time—the time interval from onset of the motion stimulus until the marmosets’ indicated their choice—for a range of motion SSs. Arrow heads indicate the median reaction time for each distribution. (B) Median reaction time as a function of SS. For comparison, B also shows median reaction times for four human observers performing the same motion estimation task. Both humans and marmosets exhibit a typical increase in reaction time as SS was reduced. However, the increase in reaction time of the human observers was less dramatic than that of the marmosets. In B, error bars show bootstrap estimates of 95% CIs. Solid curves show least-squares fits of a hyperbolic tangent function.
