Figure 5.

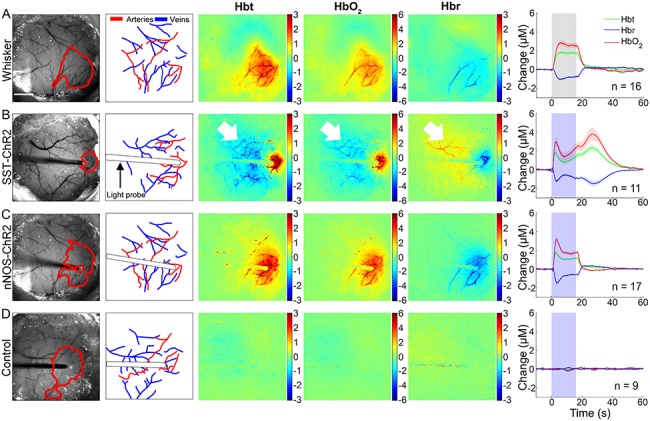
Hemodynamic responses to 16s stimulation (A) mechanical whisker stimulation (5 Hz), (B) photostimulation (99 Hz, 0.24 mW or 20 Hz, 0.63 mW) of SST-ChR2 mouse, (C) photostimulation of nNOS-ChR2 mice, (D) photostimulation of control mice. First column: representative surface vasculature overlying somatosensory cortex (at 575 nm illumination), ROI for analysis shown in red. Scalebar represents 1 mm. Second column: vessel map showing surface arteries and veins. Third, fourth, and fifth column: representative spatial activation map of trial-averaged changes in [Hbt], [HbO2], and [Hbr], respectively, with respect to baseline during stimulation. Color bar represents change (μM). Sixth column: mean hemodynamic time series within whisker barrel cortex ROI (mean ± SEM, n represents number of mice). Grey box indicates whisker stimulation, blue box indicates photostimulation. White arrowheads indicate negative surround response.
