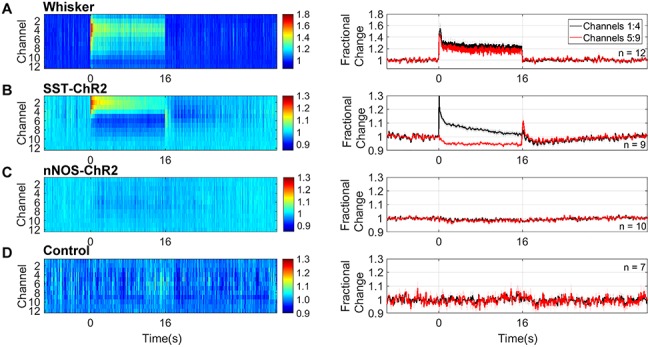
Figure 6.

Neural responses to 16s stimulation (A) mechanical whisker stimulation (5 Hz), (B) photostimulation (99 Hz, 0.24 mW or 20 Hz, 0.63 mW) of SST-ChR2 mice, (C) photostimulation of nNOS-ChR2 mice, (D) photostimulation of control mice. First column: mean MUA response across cortical layers. Color bar represents fractional change. Second column: mean time series of response through different cortical layers. Data shown are mean ± SEM, n represents number of mice.
