
Figure 2.
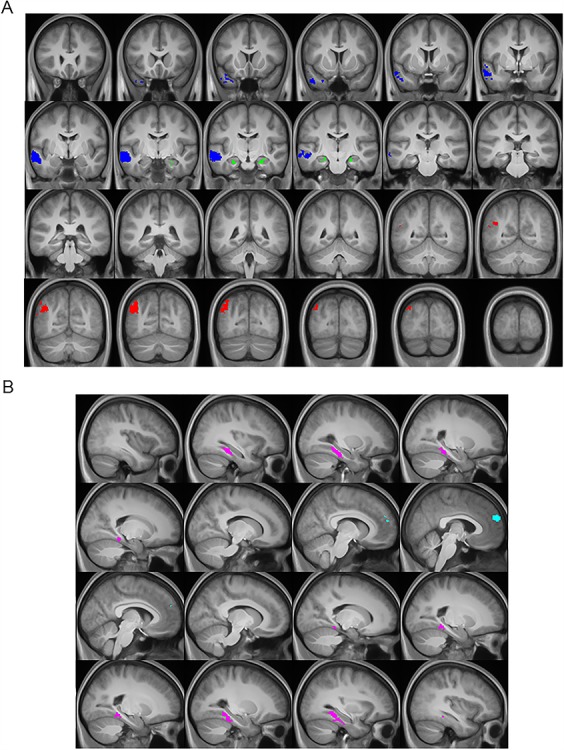
A. Core network ROIs examined for the MVPA overlaid on the across-participant mean T1-weighted anatomical image. Hippocampus shown in green, left MTG/ATL shown in blue, and left AG shown in red. Each core ROI was identified with the contrast of (memory + simulation) > sentence. The coronal slices are spaced every 5 mm with the most anterior (top left) and posterior (bottom right) corresponding to y = 22 and y = −90, respectively. B. Content-selective ROIs examined for the MVPA overlaid on the across-participant mean T1-weighted anatomical image. PHC is shown in magenta and the DMPFC shown in cyan. Content-selective ROIs were identified with the contrast of locations > people and vice versa (for the PHC and DMPFC, respectively). The sagittal slices are spaced every 5 mm with the most right (top left) and left (bottom right) corresponding to x = 39 and x = −36, respectively.