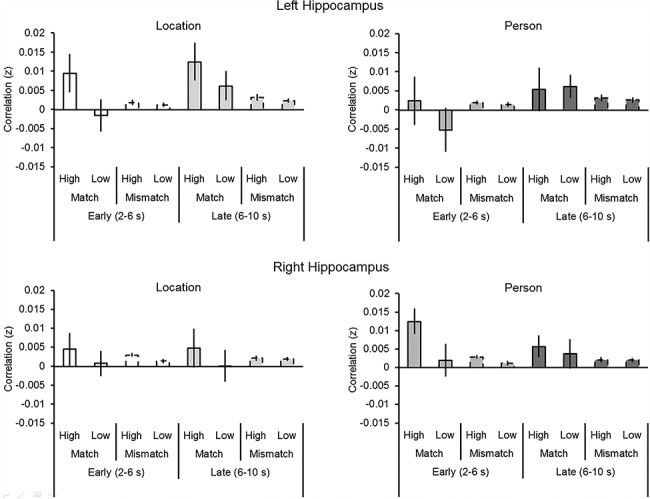
Figure 3.

Memory–simulation similarity (i.e., Fisher z-transformed Pearson’s correlation, r) within the hippocampus as function of Time Window (early and late), Correlation Type (match and mismatch), Vividness (high and low), Detail Type (person and location), and Hemisphere (left and right). Error bars denote mean (±1 SE) similarity.
