
Figure 4.
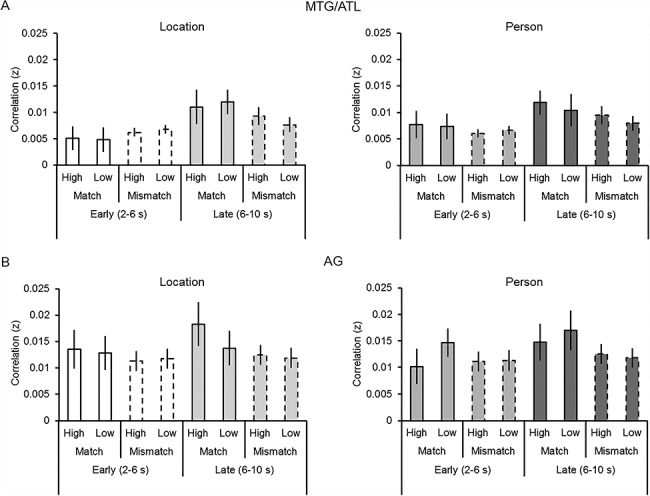
Memory–simulation similarity (i.e., Fisher z-transformed Pearson’s correlation, r) within the MTG/ATL (A) and AG (B) as a function of Time Window (early and late), Correlation Type (match and mismatch), Vividness (high and low), and Detail Type (person and location). Error bars denote mean (±1 SE) similarity.