
Figure 2.
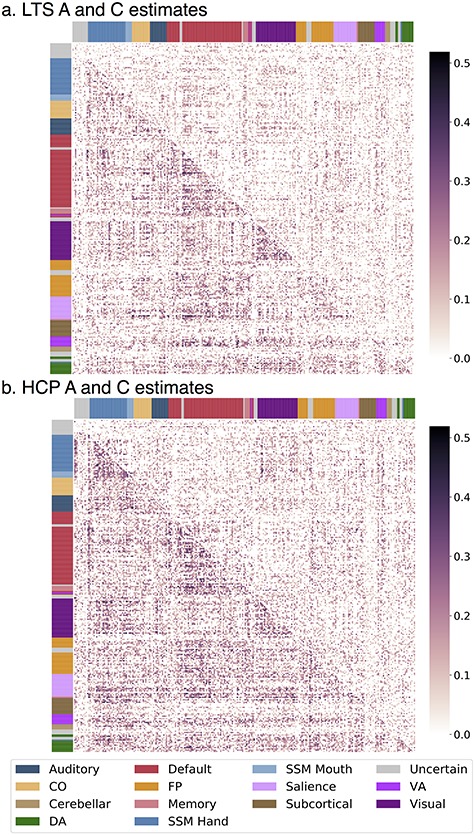
Connection-wise estimates of additive genetic (A) and shared environmental (C) influences. Matrices contain estimates from univariate twin models with the spatial location of each cell (estimate) corresponding to the functional connection between two regions. Assignment to a priori networks is represented by colored bars along x- and y-axes. Different estimates are displayed in upper and lower triangles. (a) LTS sample A and C estimates are in the lower and upper triangles, respectively. (b) HCP sample A and C estimates are in the lower and upper triangles, respectively. CO, cingulo-opercular; DA, dorsal attention; FP, frontoparietal; SSM, sensory/somatomotor; VA, ventral attention.