Figure 1.

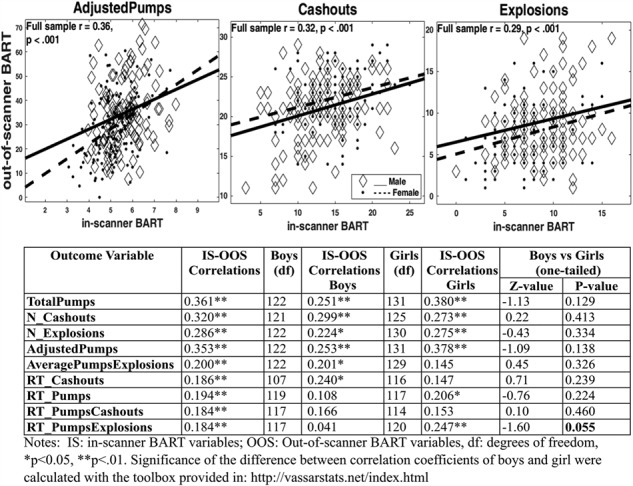
Scatterplots of the AdjustedPumps, Cashouts, and Explosions variables (upper panel). Pearson correlations between out-of-scanner (OOS) and in-scanner (IS) BART performance of boys and girls (lower panel).

Scatterplots of the AdjustedPumps, Cashouts, and Explosions variables (upper panel). Pearson correlations between out-of-scanner (OOS) and in-scanner (IS) BART performance of boys and girls (lower panel).