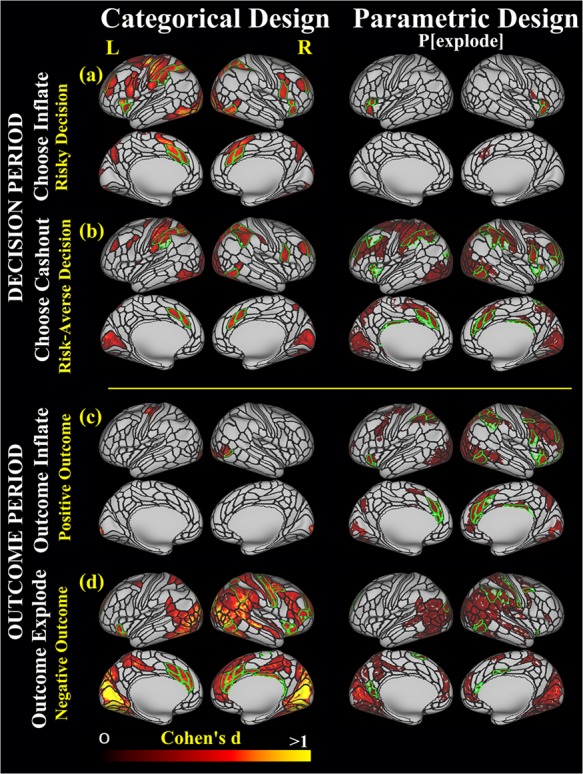
Figure 2.

Cortical regions with significant brain activation (masked by FDR-corrected activation map, P < 0.05) that are also above our Cohen’s d criteria (Cohen’s d > 0.35 for categorical and Cohen’s d > 0.2 for parametric design) in the categorical and parametric model related to the two phases of the BART, decision-making and outcome (feedback): (a) risky decision (ChooseInflate); (b) risk-averse decision (ChooseCashout), (c) positive outcome (OutcomeInflate; successful balloon inflation and monetary gain); (d) negative outcome (OutcomeExplode; balloon explosion and no money). Black outlines display the HCP-MMP1.0 parcellation. Green outlines demarcate the HCP-MMP1.0 parcels that contained an ROI that was selected for further analysis. Subcortical regions that were selected as ROIs in the categorical and parametric designs are listed in Supplementary Tables S9 and S10, respectively.
