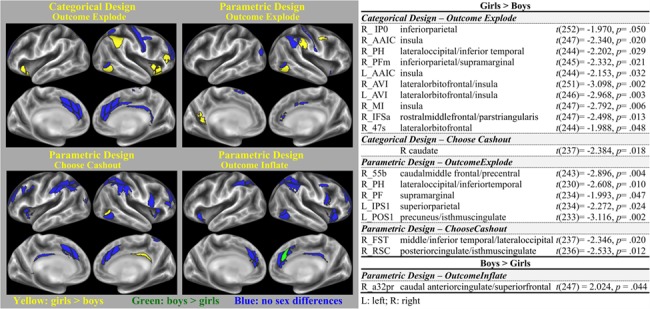
Figure 3.

Cortical regions with significant sex differences among the selected ROIs in the categorical and parametric models. Yellow parcels display the regions with greater activation in girls than boys; green parcels display the regions with greater activation in boys than girls. Blue parcels represent regions with no differences in activation between boys and girls. Only contrasts including regions that showed significant sex differences are displayed here.
