Figure 3.

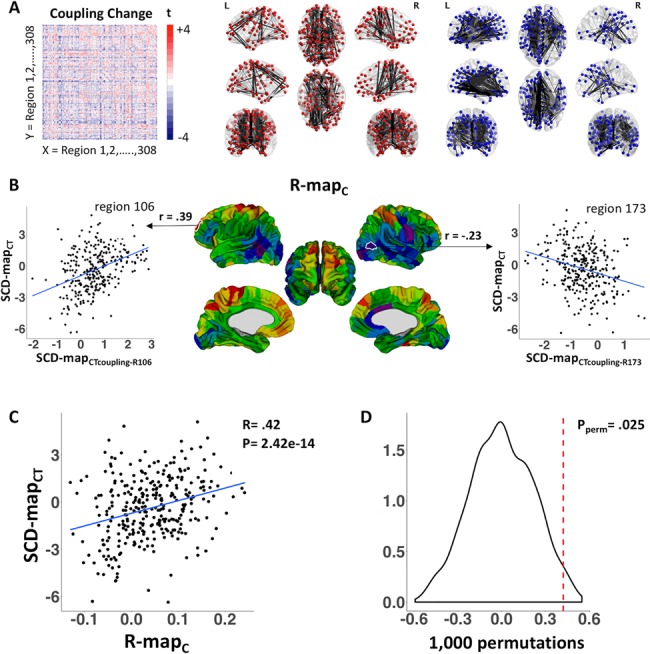
SCD effects on structural covariance. (A) SCD effects on CT coupling between each pair of cortical regions: brain-wide coupling change matrix and visualization of top 5% of positive (red) and negative (blue) edges. (B) Regional differences in r-mapC values. r-mapC correlation coefficients are projected onto the cortical sheet for visualization. Scatterplots demonstrate that region 106 in the rostral frontal cortex demonstrates increased coupling to regions that become thicker with mounting SCD, whereas region 173 in the lateral occipitotemporal junction demonstrates increased coupling to regions that become thinner with mounting SCD. (C) Scatterplot demonstrates that regional differences in the alignment between altered CT coupling and CT change in SCD are themselves strongly correlated with regional differences in CT change in SCD. (D) Permutation testing distribution containing 1000 null rC values.
