
Figure 6.
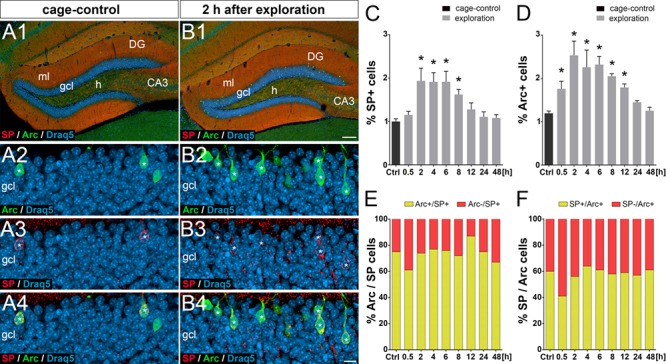
Granule cell ensembles activated by placing mice into a novel environment coexpress Arc and somatic SP. (A, B) Immunofluorescence labeling of the dentate gyrus (DG) for SP (red) and activity-regulated cytoskeleton-associated protein (Arc, green) under control conditions (A) and 2 h after placing the mice into a novel environment (B). Draq5 (blue) was used to label nuclei. (A2–A4) Higher magnification of a portion of the suprapyramidal blade in a cage control animal. Granule cells coexpressing somatic SP and Arc are indicated (asterisks). (B2–B4) Higher magnification of a portion of the suprapyramidal blade 2 h after placing the mouse into a novel environment. Note the increase in the fraction of granule cells expressing Arc and SP. Granule cells coexpressing somatic SP and Arc are indicated (asterisks). ml, molecular layer; h, hilus. Percentage of somatic SP-positive cells (C) and Arc-positive cells (D) in the suprapyramidal blade of the gcl. Cage control (Ctrl) animals and animals at different time points (0.5, 2, 4, 6, 8, 12, 24, and 48 h) after exposure to a novel environment are shown. One-way ANOVA with Bonferroni correction for multiple comparisons: F(8, 36) = 28.31 for (C), F(8, 36) = 29.07 for (D); *P < 0.05; N = 5 for each time point. (E) The percentages of somatic SP-positive cells also containing Arc are illustrated (mean values of N = 5 animals per time point). (F) The percentages of Arc-positive cells also containing SP in their somata are shown (mean values of N = 5 animals per time point). Scale bars: 100 μm (B1), 10 μm (B4).