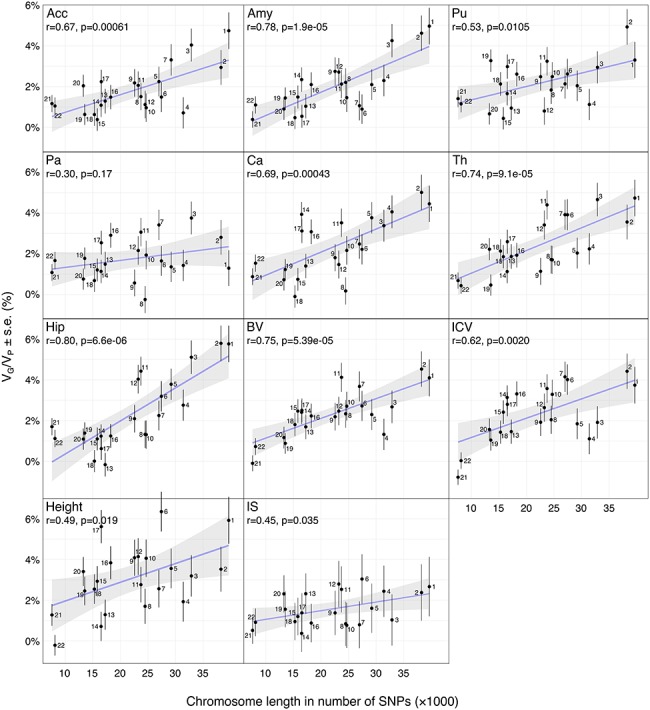
Figure 2.

Scatter plots of the number of SNPs per chromosome versus VG/VP estimates computed for each chromosome. VG/VP estimates were obtained by partitioning SNPs across chromosomes and computed using the GCTA REML unconstrained method for total subcortical volumes. Age, sex, center, and the top 10 principal components were included as covariates. The error bars show the SEs of the VG/VP estimates.
