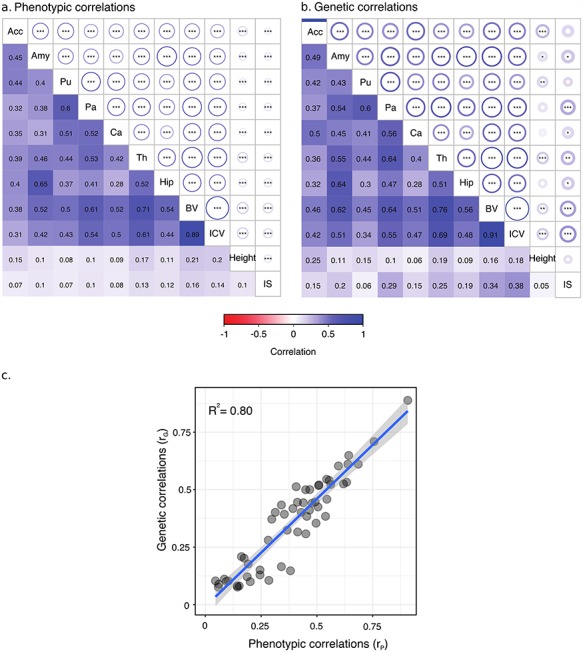
Figure 5.

Phenotypic and genetic correlations. Significant phenotypic (a) and genetic (b) correlations were observed for most phenotypes. Correlation estimates are shown in the lower triangular part of the matrices, statistical significance in the upper triangular part. Circle radius represents correlation strength, stars indicate statistical significance of the correlation being non null (*P < 0.05, **P < 0.01, ***P < 0.001). The scatter plot (c) of phenotypic versus genetic correlations.
