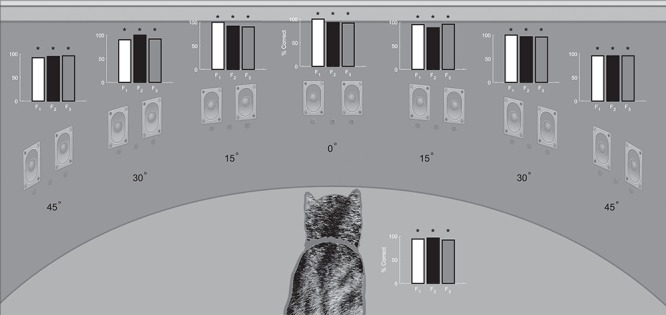
Figure 3.

Prelesion visual field assessment. Plotted here in bar graphs is the performance of each animal on 20–30 visual-only trials after training at each location within the central 90° of visual space. The % correct on the vertical axis of the bar graphs refers to correct orientation/approach responses at that location. Vertical lines represent standard error *P < 0.01.
