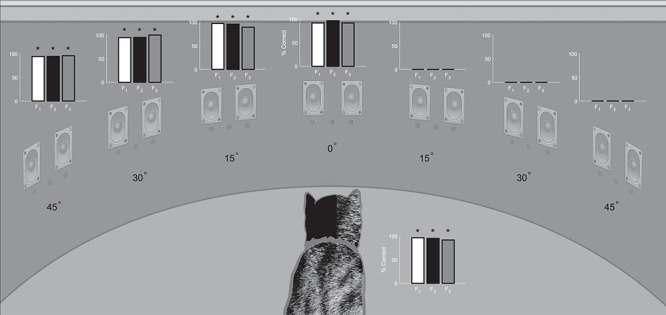
Figure 4.

Postlesion visual field assessment. The accuracy of visual orientation/localization responses for each animal was quantified 2.5 months or more after unilateral visual cortex ablation. Bar graphs indicate the % correct on the final 40–80 visual-only trials at each location after the animals returned to their prelesion performance on the ipsilesional side of space. Note the absence of responses to V stimuli in contralesional (right) space. The bar graph next to the animal indicates performance on No Go ‘catch’ trials. Conventions are the same as in Figure 3.
