
Figure 6.
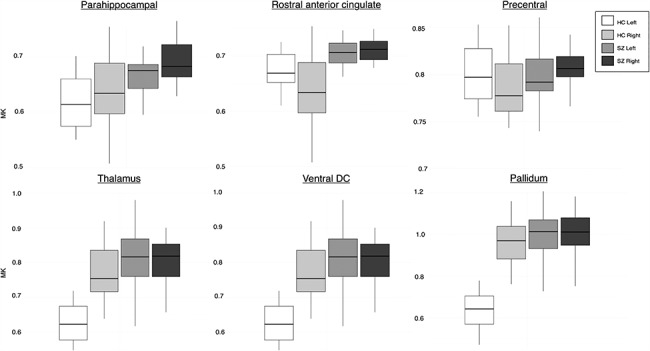
MK values of a sub-set of cortical and subcortical ROIs with significantly different μLI (P < 0.001) demonstrating the patterns of lateralization between hemispheres in HC and SZ groups. Color indicates group and hemisphere (HC left—white, HC right—light gray, SZ left—medium gray, SZ right—dark gray). A greater increase in MK is observed in the non-dominant hemisphere in SZ. The top row of cortical ROIs shows that the differences in lateralization in SZ are due to a range of asymmetry patterns including reduced asymmetry but in the same direction as HC (parahippocampal), total loss of asymmetry (rostral anterior cingulate), and reversed asymmetry in comparison with HC (precentral).