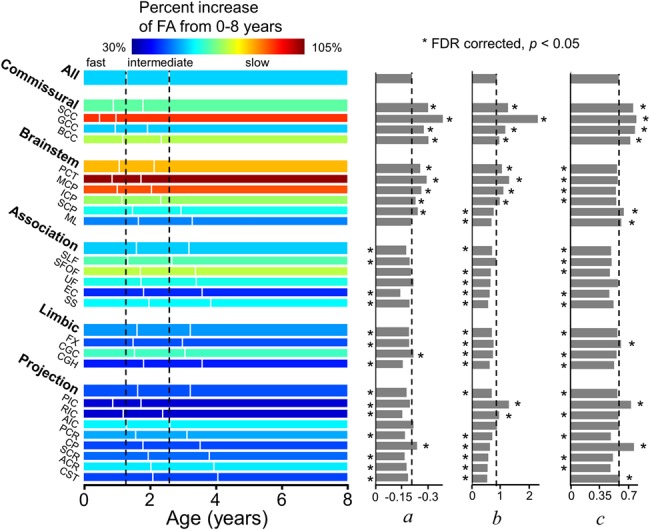
Figure 5.

Illustration of percentage increase of FA from 0 to 8 years (with the percentage increase values listed in Table 1), three phases (with the start/end ages and phase length listed in Tables 2) and estimated fitting parameters a, b, and c of exponential curves of FA across all major WM tracts and tract groups. Measures of averaged entire WM were used as the reference. On the left panel, the WM maturation of every WM tract and tract group was displayed in three phases (fast, intermediate, and slow phases), with the boundaries of the three phases of the entire WM displayed as two reference dashed lines. The color bar encodes the percent increases of FA from 0 to 8 years. * indicates significant difference of a fitting parameter a, b, or c from that of the averaged entire WM, shown as black dashed lines. * placed on the left side indicates the abs(a), b, or c is significantly smaller than that of the entire WM’s, and vice versa. Please see the Materials and Methods section for abbreviations of WM tract names.
