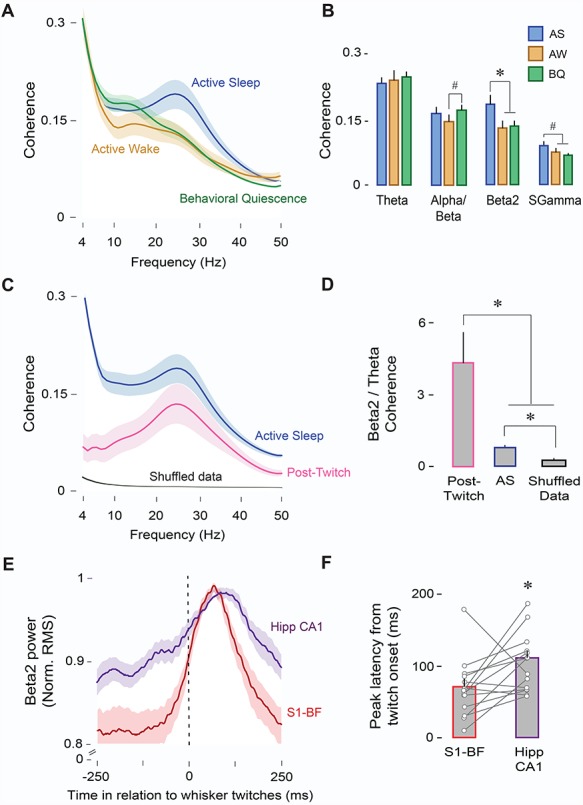
Figure 4.

AS enables oscillatory coupling between S1-BF and Hipp CA1. (A) Mean LFP-LFP coherence spectra between S1-BF and Hipp CA1 (n = 14 pups, 14 LFP pairs) during AS (blue), AW (orange), and BQ (green). Shaded area indicates SE. (B) Mean (+ SE) LFP-LFP coherence values across frequency bands and behavioral states (AS, AW, and BQ). * denotes significant difference (P < 0.01). # denotes significant difference (P < 0.05). (C) Mean LFP-LFP coherence spectra between S1-BF and Hipp CA1 (n = 14 pups, 14 LFP pairs) during AS (blue), post-twitch periods (500-ms window, pink), and shuffled data (black). Shaded area indicates SE. (D) Mean beta2/theta ratios for coherence values during AS, post-twitch periods, and shuffled data. * denotes significant difference (P < 0.05). (E) Mean normalized twitch-triggered LFP power (beta2; 20–30 Hz; root mean square) pooled across subjects (14 pups, 14 LFPs) for S1-BF (red) and Hipp CA1 (purple). Shaded area indicates SE. Vertical line denotes whisker twitch onset. ( f ) Mean (+ SE) peak latency in (E) for S1-BF (red) and Hipp CA1 (purple). Vertical lines depict latency data from individual pups. * denotes significant difference (P < 0.05).
