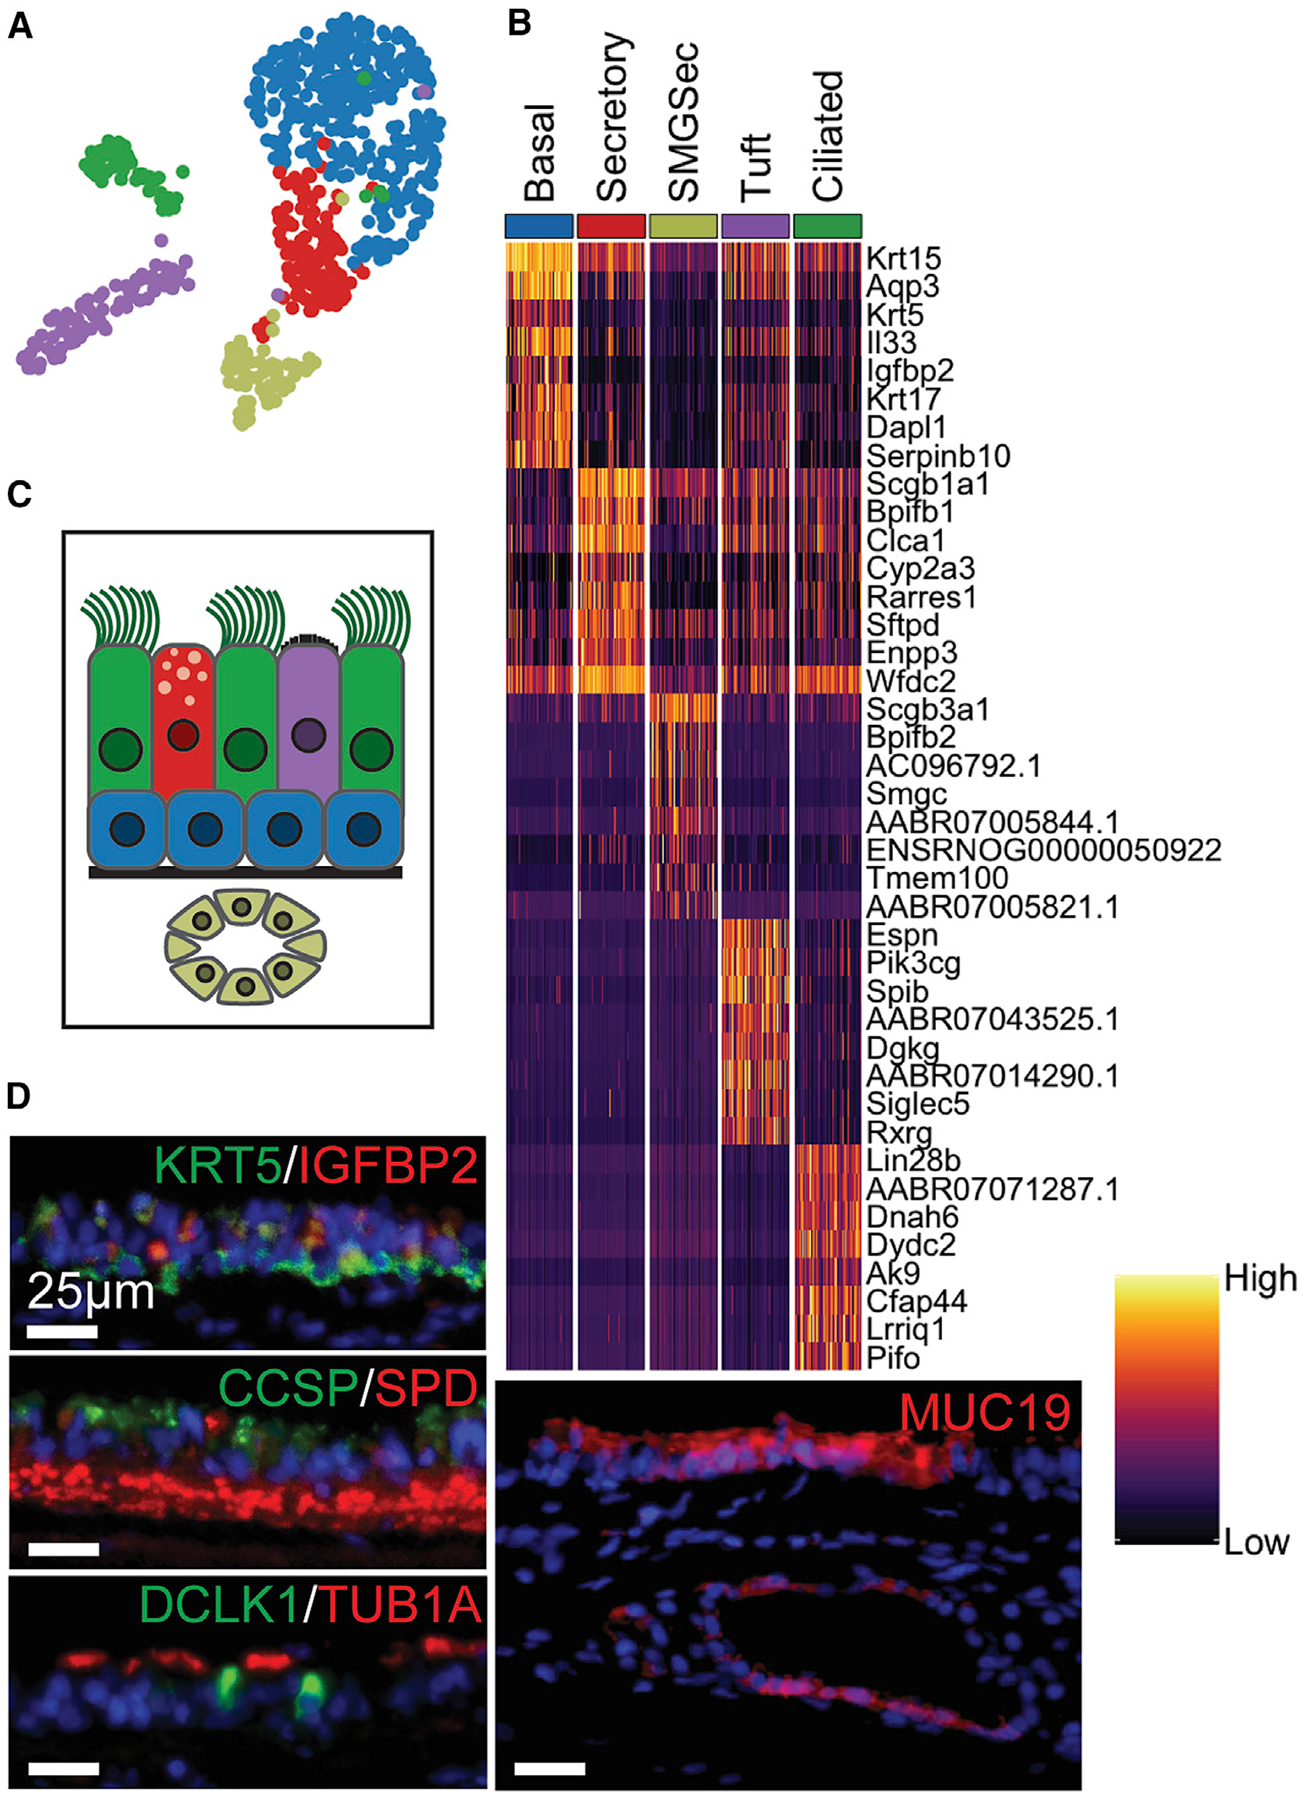
Figure 1. Single-Cell Evaluation of Native Rat Tracheal Epithelium.

(A) Uniform Manifold Approximation and Projection (UMAP) of epithelial cell clusters.
(B) Heatmap of top DEGs for each cluster (lowest p value, see Method Details); columns grouped by cluster representing 60 randomly selected cells per cluster to show cluster heterogeneity; rows represent unity normalized expression of top 8 DEGs per cluster.
(C) Diagram of native rat tracheal epithelium, color-coded to UMAP clusters.
(D) IF of key markers for each cluster, including KRT5/IGFBP2 (BCs), CCSP/SPD (secretory; red background staining in lamina propria), DCLK1(tuft)/Tub1α(ciliated), and MUC19 (SMG secretory) (scale bars, 25 μm).
See also Figure S1.
