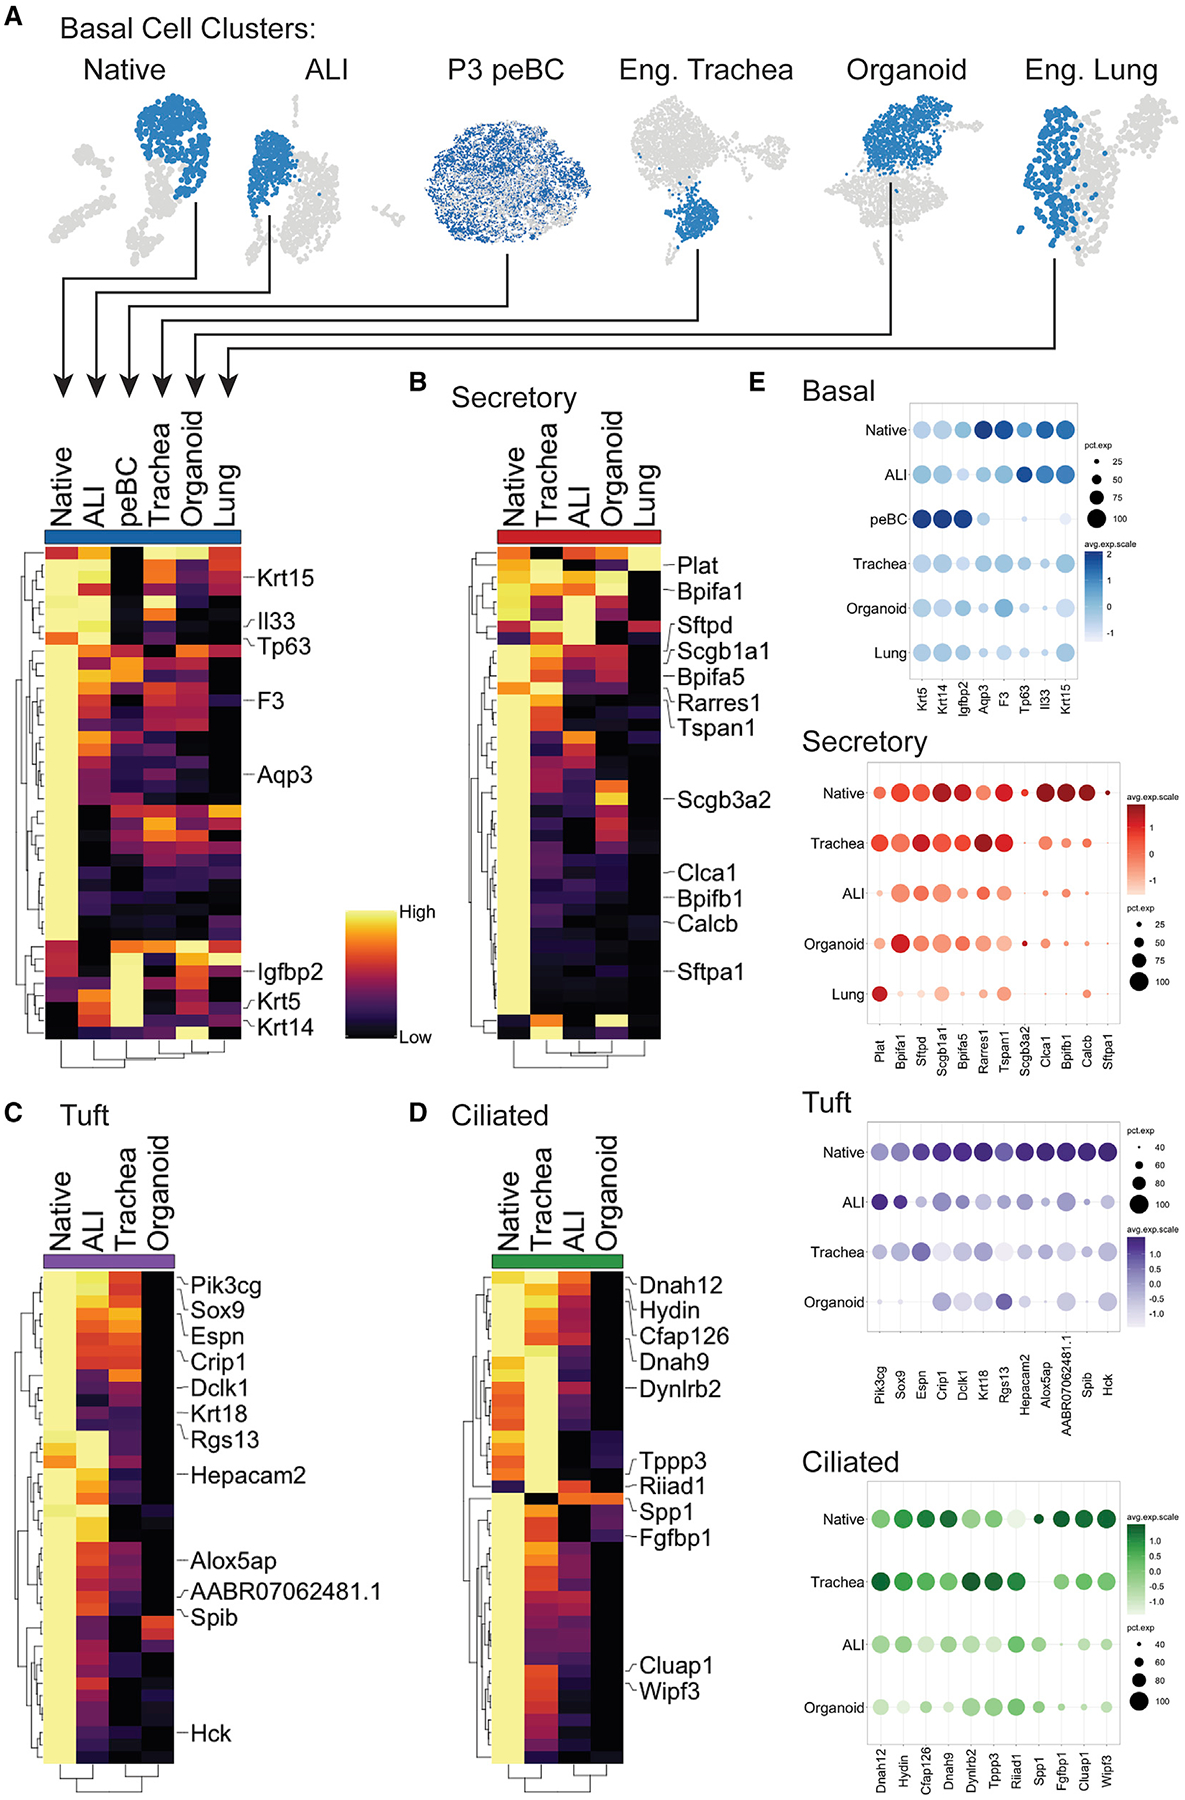
Figure 7. Similarities and Differences among Engineered Cell Populations.

(A–D) Cell-type clusters were merged and re-scaled (A). Heatmaps of comparisons for (A) basal, (B) secretory, (C) tuft, and (D) ciliated cells. Heatmap columns are labeled with cluster origin and represent the average expression per cluster; rows represent the unity normalized expression of the top 40 DEGs in native (greatest average log fold-change, see Method Details) for the given cell type, with key genes labeled; rows and columns are ordered by dendograms.
(E) Dot plots of key genes for basal, secretory, tuft, and ciliated cells.
See also Figure S7.
