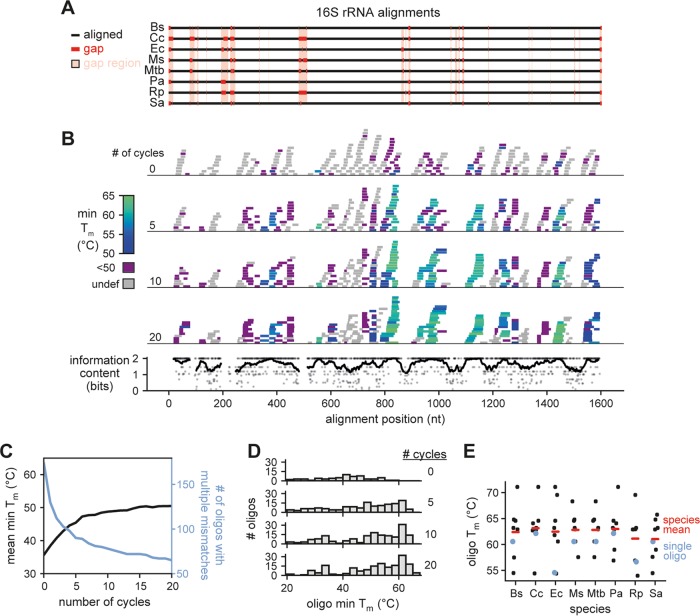
FIG 1.
Oligonucleotide selection for 16S rRNA. (A) Alignment of 16S sequences from 8 bacterial species (Ec, E. coli; Pa, P. aeruginosa; Rp, R. parkeri; Cc, C. crescentus; Bs, B. subtilis; Ms, M. smegmatis; Mtb, M. tuberculosis; Sa, S. aureus). Alignment gaps are shown as red lines in the particular species of the gap. Regions with a gap in any species are highlighted in pink; these regions were not considered when designing oligonucleotides. (B) The position, length, and minimum Tm of all oligonucleotides plotted against the 16S alignment after the indicated number of optimization cycles (top). The information content at each nucleotide position of aligned regions is also shown (bottom, points). To highlight conserved regions, a sliding average information content is also plotted (bottom, line). (C) Oligonucleotide Tm statistics after multiple cycles of the Tm optimization algorithm. For each oligonucleotide (n = 250), we calculated the minimum Tm across the 8 species considered and then plotted the mean of this value across all oligonucleotides (black). The Tm cannot be accurately estimated for oligonucleotides with multiple sequential mismatches; the number of oligonucleotides with an undefined Tm is also plotted (blue). (D) Histograms of minimum Tm for oligonucleotides at the indicated number of optimization cycles. Data were generated as in panel C, but oligonucleotide Tm minima were used to generate histograms rather than taking the mean across all oligonucleotides. Oligonucleotides with an undefined Tm were not included in the histograms. (E) Distribution of Tm values for each 16S-targeting oligonucleotide (n = 8) for each individual species indicated. The mean Tm of oligonucleotides for each species is also shown (red lines). Note that the same oligonucleotides are used for each species, but because of 16S sequence variability, the Tm can vary, as illustrated for one particular oligonucleotide (blue).

