FIG 3.
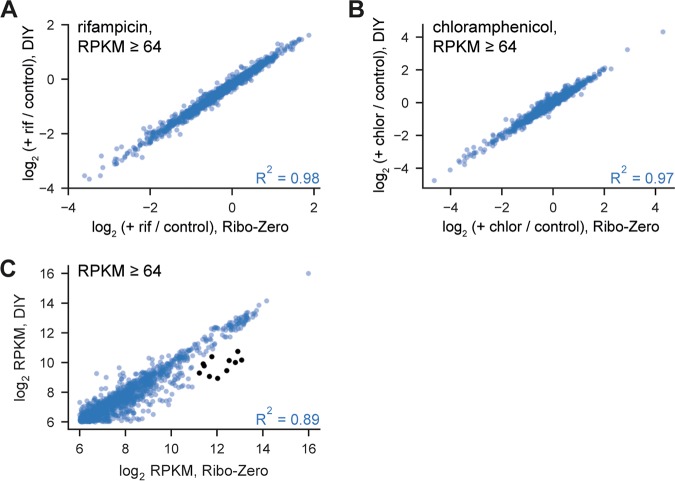
Our rRNA depletion strategy performs comparably to Ribo-Zero for RNA-seq. (A) Scatterplot showing correlation between log2 fold change for E. coli coding regions following rifampicin treatment, comparing rRNA depletion via Ribo-Zero with our depletion strategy. Fold changes were calculated as the ratio of RPKM between rifampicin-treated and untreated samples. All coding regions with at least 64 RPKM in both untreated samples (n = 1,294) were considered in the analysis. (B) Scatterplot showing correlation between log2 fold change for E. coli coding regions following chloramphenicol treatment, comparing rRNA depletion via Ribo-Zero with our depletion strategy. Fold changes were calculated as the ratio of RPKM between chloramphenicol-treated and untreated samples. All coding regions with at least 64 RPKM in both untreated samples (n = 1,294) were considered in the analysis. (C) Scatterplot showing correlation between read counts (RPKM) for E. coli coding regions treated with Ribo-Zero and our do-it-yourself (DIY) depletion strategy. All coding regions with at least 64 RPKM in both samples (n = 1,294) were considered in the analysis. Eleven outliers preferentially depleted by our method are highlighted (black); also see Fig. S2D.

