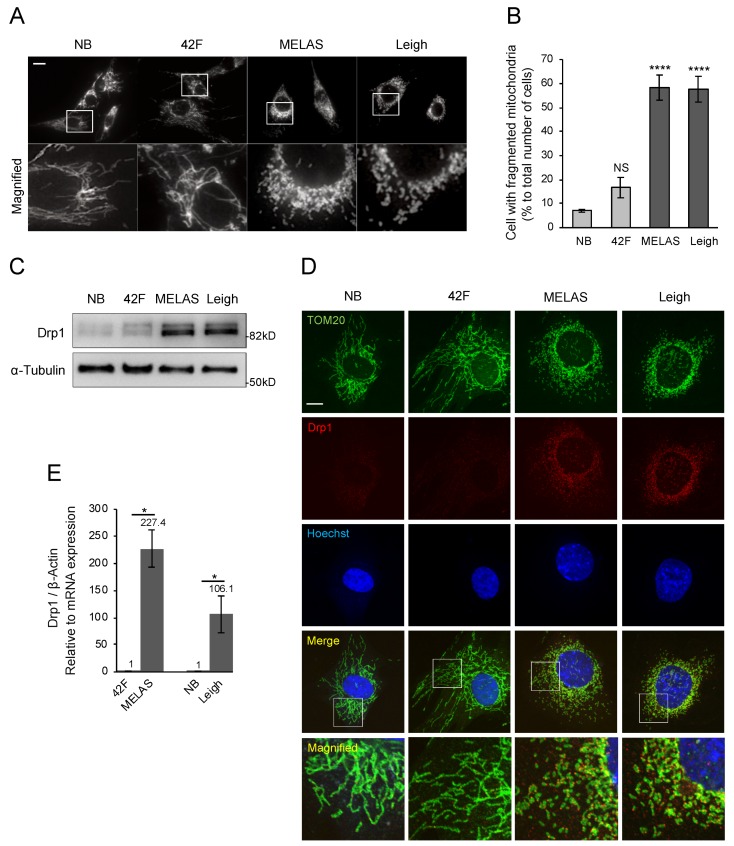
Figure 4.
Mitochondrial fragmentation in MD fibroblasts. (A,B) Mitochondrial fragmentation is increased in MD fibroblasts. Cells were stained with anti-Tom20 antibody. Scale bar represents 20 μm. Fragmented mitochondria are defined in Supplementary Figure S1A. Quantification was performed from 300 cells per experiment examined in three separate experiments. Data are shown as the mean ± SEM. Statistical analysis was performed with one-way ANOVA followed by Dunnett’s test. ****P < 0.0001 compared with NB. (C) Mitochondrial morphology-related proteins were analyzed by Western blotting. MD fibroblasts had increased Drp1, and alpha-tubulin was used as loading control. (D) Anti-Tom20 and anti-Drp1 antibodies were used to visualize mitochondria and Drp1. Drp1 accumulates on mitochondria in MD fibroblasts. Scale bar represents 10 μm. (E) Drp1 expression levels were analyzed by qRT-PCR and compared to age-related controls (n = 3 independent experiments). *P < 0.05 (Student’s t-test).

