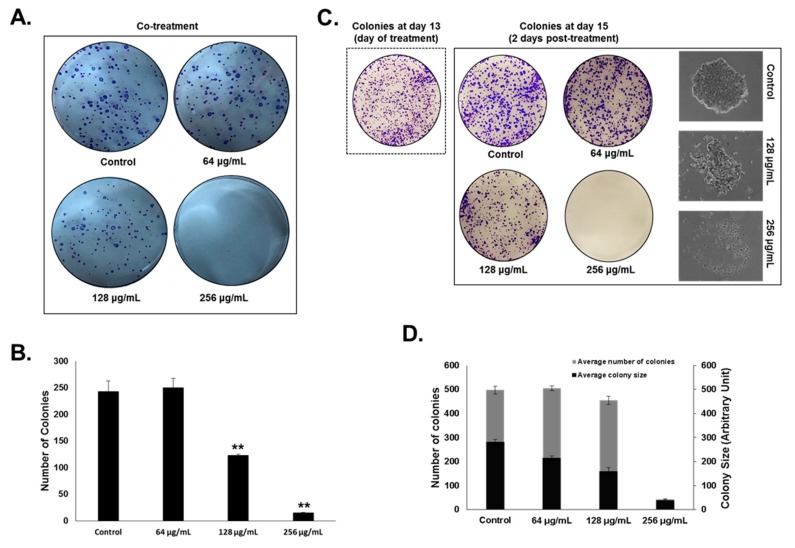
Figure 2.
OMEO inhibits HT-29 colony growth. (A,B) Inhibition of HT-29 colony growth by various concentrations of OMEO (0, 64, 128, and 256 μg/mL) was assessed by measuring the number of the colonies obtained in control and OMEO-treated plate, as described in Section 2.5 Values are represented as mean ± SD of n = 3 (** p < 0.005). (C) HT-29 colonies were first allowed to form in normal media for 13 days as described in Section 2.5 Formed colonies were then treated with or without increasing concentrations of OMEO, and allowed to grow for three more days before crystal violet staining. The size and morphology of the growing colonies was tracked over time with the EVOS XL Core Cell Imaging System (Life Technologies) at 400×. (D) Inhibition of colony growth was assessed by measuring the number and size (surface area) of the colonies obtained in control and OMEO-treated plates, as described in Section 2.5 Data represent the mean of three independent experiments carried out in duplicate. Values are represented as mean ± SD of n = 3 (* p < 0.05, ** p < 0.005).

