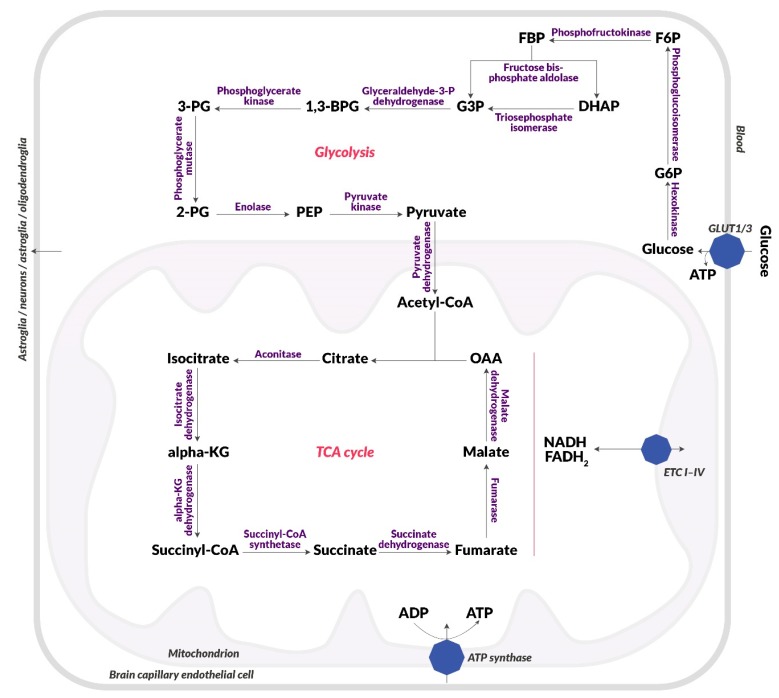
Figure 1.
Diagram of glucose metabolism. Blood glucose uptake, glycolysis, citric acid cycle, electron Table 1, and an insulin-independent transporter (GLUT3). Then, it is metabolized in cytosol in glycolysis to pyruvic acid, which passes into the mitochondria. Pyruvate dehydrogenase converts it to acetyl-CoA, which is included in the citric acid cycle (TCA), which runs in the mitochondrial matrix. There, NADH and FADH2 are produced, which end up in the electron transport chain (I-IV) (ETC I-IV), which is located on the inner membrane of the mitochondrion. NADH and FADH2 are used to create a proton gradient, which is then used to produce ATP by ATP synthase. Abbreviations: 1,3-BPG: 1,3-bisphosphoglyceric acid; 2-PG: 2-phosphoglyceric acid; 3-PG: 3-phosphoglyceric acid; α-KG: Alpha-ketoglutarate; F6P: Fructose-6-phosphate; FBP: Fructose-1,6-bisphosphate; G3P: Glyceraldehyde-3-phosphate; G6P: Glucose-6-phosphate; GLUT1: Insulin-independent glucose transporter; GLUT4: Insulin-dependent glucose transporter; IR: Insulin receptor; OAA: Oxaloacetic acid; PEP: Phosphoenolpyruvic acid.

