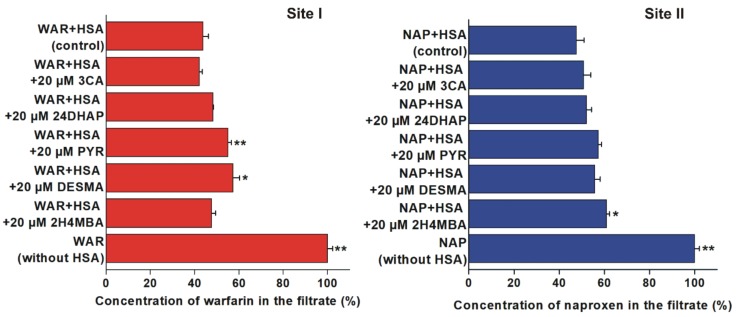
Figure 5.
Displacement of warfarin (WAR; left) and naproxen (NAP; right) from HSA based on ultrafiltration (*p < 0.05, **p < 0.01). Left: Concentration of WAR in the filtrate after ultrafiltration in the absence and presence of 3-coumaric acid (3CA), 2,4-dihydroxyacetophenon (24DHAP), pyrogallol (PYR), O-desmethylangolensin (DESMA), and 2-hydroxy-4-methoxybenzoic acid (2H4MBA) (WAR: 1 µM; HSA: 5 µM). Right: Concentration of NAP in the filtrate after ultrafiltration in the absence and presence of 3CA, 24DHAP, PYR, DESMA, and 2H4MBA (NAP: 1 µM; HSA: 1.5 µM). Means and SEM values presented are derived from three independent experiments.

