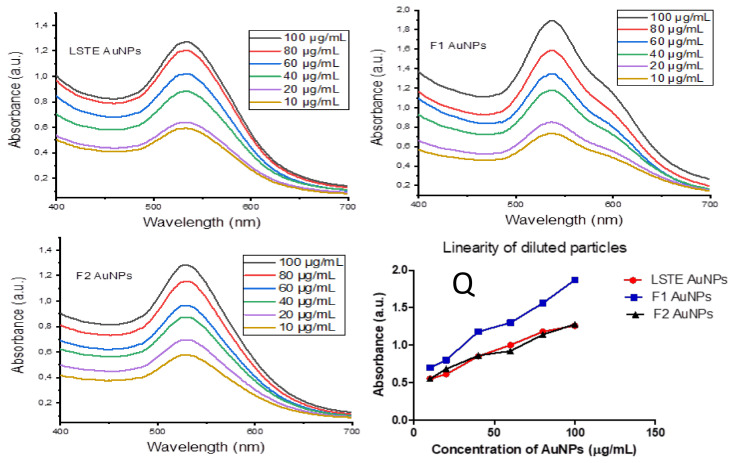
Figure 10.
Surface plasmon resonance wavelength (λmax) of diluted concentrations of LSTE-, F1- and F2- Au NPs, while (Q) represents a plot of absorbance against various concentrations, showing the linear proportionality of intensity with increasing concentration. R2 = 0.9455 (LSTE Au NPs), R2 = 0.9908 (F1 Au NPs) and R2 = 0.9848 (F2 Au NPs).

