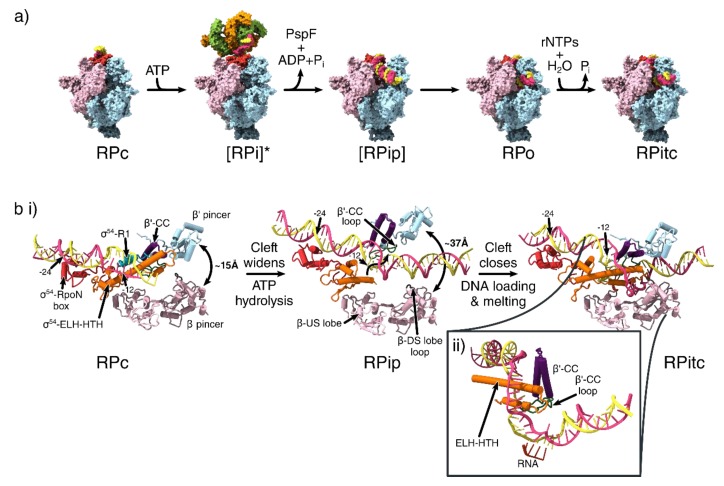
Figure 4.
Conformational changes that occur during transcription initiation. (a) The overall structures of the different functional states of transcription initiation. View is from the downstream face. Colouring is identical to that of Figure 1b for β, β’, σ54 and α subunits and Figure 3c for PspF. [] = Transient intermediate. * = indicates the use of ADP.AlFx to capture the transient intermediate state. (b) DNA melting and clamp widening during initiation. Birds-eye view of cleft, looking down into the cleft, showing only the pincers, σ54 region I and III and DNA. The σ54- RpoN box is shown in red. σ54 Region I is not resolved in RPip and RPitc models. β-DS lobe loop shown in brown, β’-CC in purple and β’-CC loop in green. (ii) Side view of the transcription bubble in the RPitc structure. RNA shown in dark orange. (PDB IDs: 5NSR (RPc), 5NSS (RPi), 6GH6 (RPip), 6GH5 (RPo), 6GFW (RPitc)).

