Figure 2.
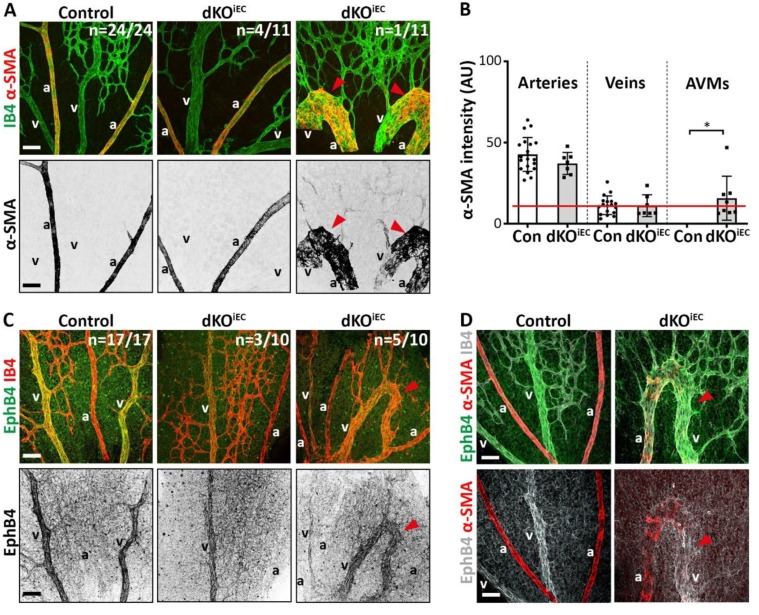
Arterial- and venous-associated markers localize normally in dKOiEC. (A) IB4 (green) and alpha smooth muscle actin (α-SMA, red) staining of Tx-treated control (n = 24) and dKOiEC (n = 11; 4/11 without AVM formation; 6/11 with α-SMA-negative AVMs; 1/11 with α-SMA-positive AVM) retinas at P6. α-SMA grayscale images are shown for visual clarity. (B) Quantification of α-SMA signal intensity per vessel type (arteries, veins, AVMs) in Tx-treated mice at P6. The red line indicates background noise level. (C) Ephrin type b receptor 4 (EphB4, green) and IB4 (red) staining of Tx-treated control (n = 17) and dKOiEC (n = 10; 3/10 without AVM formation; 2/10 with EphB4-negative AVMs; 5/10 with EphB4-positive AVMs) retinas at P6. EphB4 grayscale images are shown for visual clarity. (D) EphB4 (green/white), α-SMA (red) and IB4 (white) staining of Tx-treated control and dKOiEC retinas at P6. Red arrowheads indicate AVMs. a = artery. v = vein. Scale bar: 50 µm. * p < 0.05.

