Figure 3.
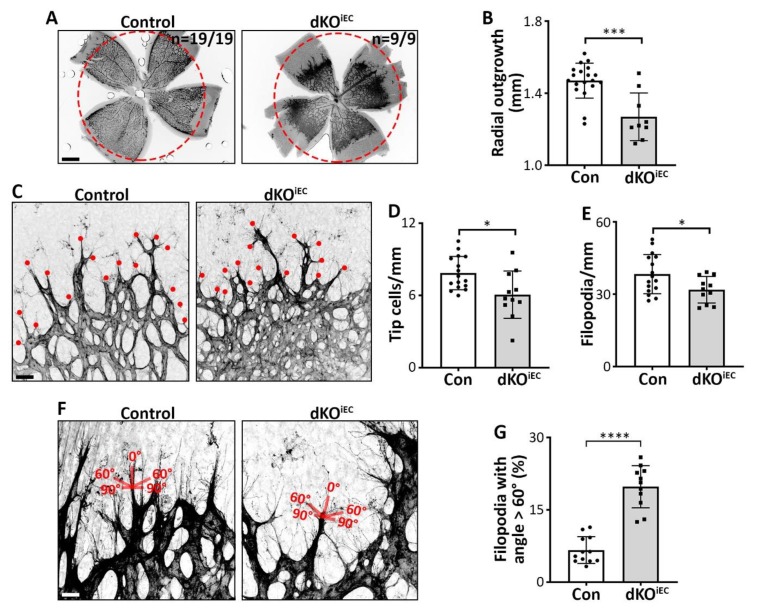
SMAD1/5 signaling regulates tip cell formation and function. (A) IB4 staining of Tx-treated control and dKOiEC retinas at P6. The red dotted circle indicates radial outgrowth from control mice. Scale bar: 500 µm. (B) Quantification of radial outgrowth in Tx-treated mice at P6. Control n = 19. dKOiEC n = 9. (C) IB4 staining of Tx-treated control and dKOiEC retinas at P6. The red dots indicate tip cells. Scale bar: 25 µm. (D) Quantification of tip cells and (E) tip cell filopodia in Tx-treated mice at P6. Control n = 16. dKOiEC n = 11. (F) IB4 staining of Tx-treated control and dKOiEC at P6. The scheme represents the angle of filopodia from respective tip cells. Scale bar: 10 µm. (G) Quantification of filopodia with an angle > 60° respective to their tip cell in Tx-treated mice at P6. Control n = 12. dKOiEC n = 11. * p < 0.05; *** p < 0.001; **** p < 0.0001.

