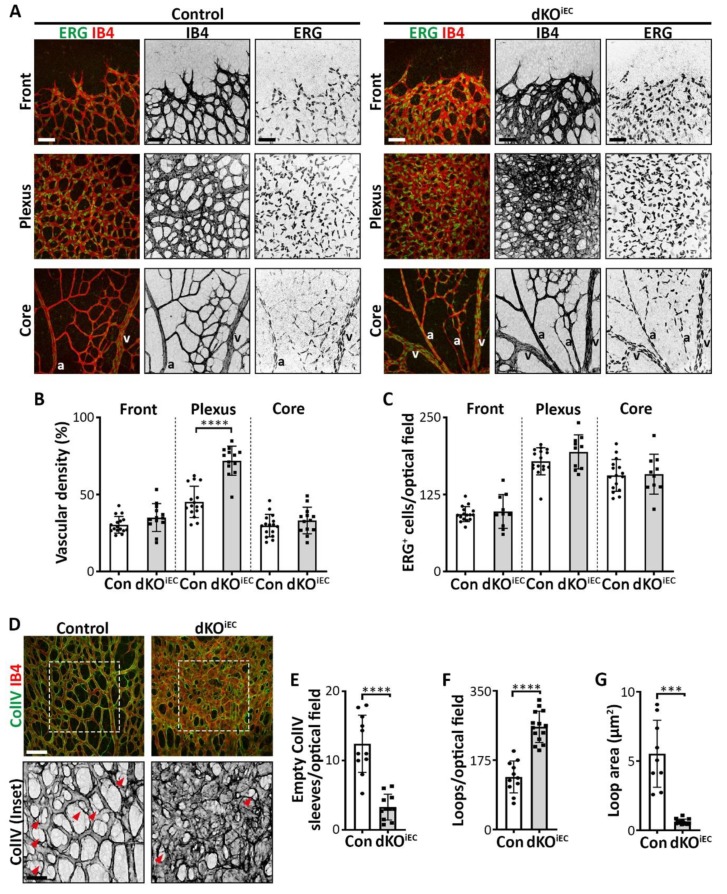
Figure 4.
dKOiEC mice show increased vascular density, reduced vessel regression and more abundant loop formation in the retinal plexus region. (A) ERG (green) and IB4 (red) staining of Tx-treated control and dKOiEC retinas at P6. Retinal leaflets have been divided into three distinct regions: (i) the frontal region with migrating tip cells; (ii) the intermediate remodeling plexus region; and (iii) the mature core region around the optic nerve. Grayscale images of IB4 and ERG staining are shown for visual clarity. a = artery. v = vein. Scale bar: 50 µm. (B) Quantification of vascular density at the retinal vascular frontal, plexus and core regions of Tx-treated mice at P6. Control n = 16. dKOiEC n = 13. (C) Quantification of ERG+ ECs at the retinal vascular frontal, plexus and core regions of Tx-treated mice at P6. Control n = 16. dKOiEC n =10. (D) Collagen IV (ColIV, green) and IB4 (red) staining of Tx-treated control and dKOiEC retinas at P6. ColIV grayscale images are shown for visual clarity. White dotted box highlights enlarged inset. Red arrows indicate empty ColIV sleeves. Scale bars: 50 µm (upper panel) and 25 µm (inset). (E) Quantification of empty ColIV sleeves in the retinal plexus region of Tx-treated mice at P6. Control n = 11. dKOiEC = 11. (F,G) Quantification of the number of vascular loops and the mean vascular loop area in the retinal plexus region of Tx-treated mice at P6. Control n = 11. dKOiEC = 14. *** p < 0.001; **** p < 0.0001.

