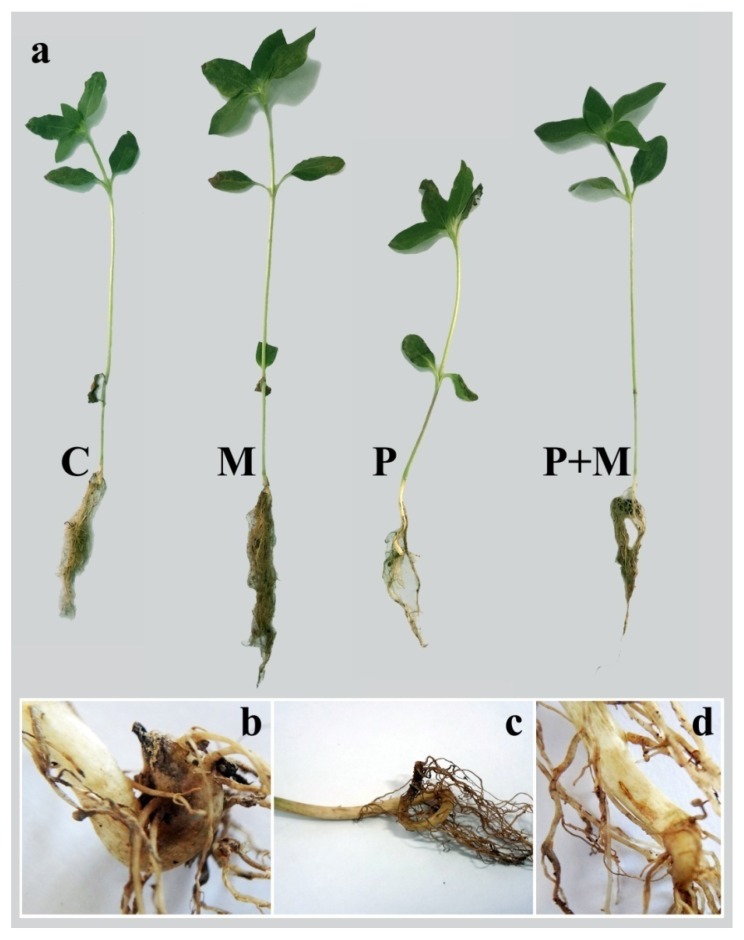
Figure 6.
A photograph showing full sunflower plants (at 28 dpi) in response to colonization with R. irregularis and/or infection with R. solani (a), as well as the disease symptoms (b–d), where, C = untreated control, M = colonized with R. irregularis, P = infected with R. solani, and M+P = colonized with R. irregularis and infected with R. solani.

